
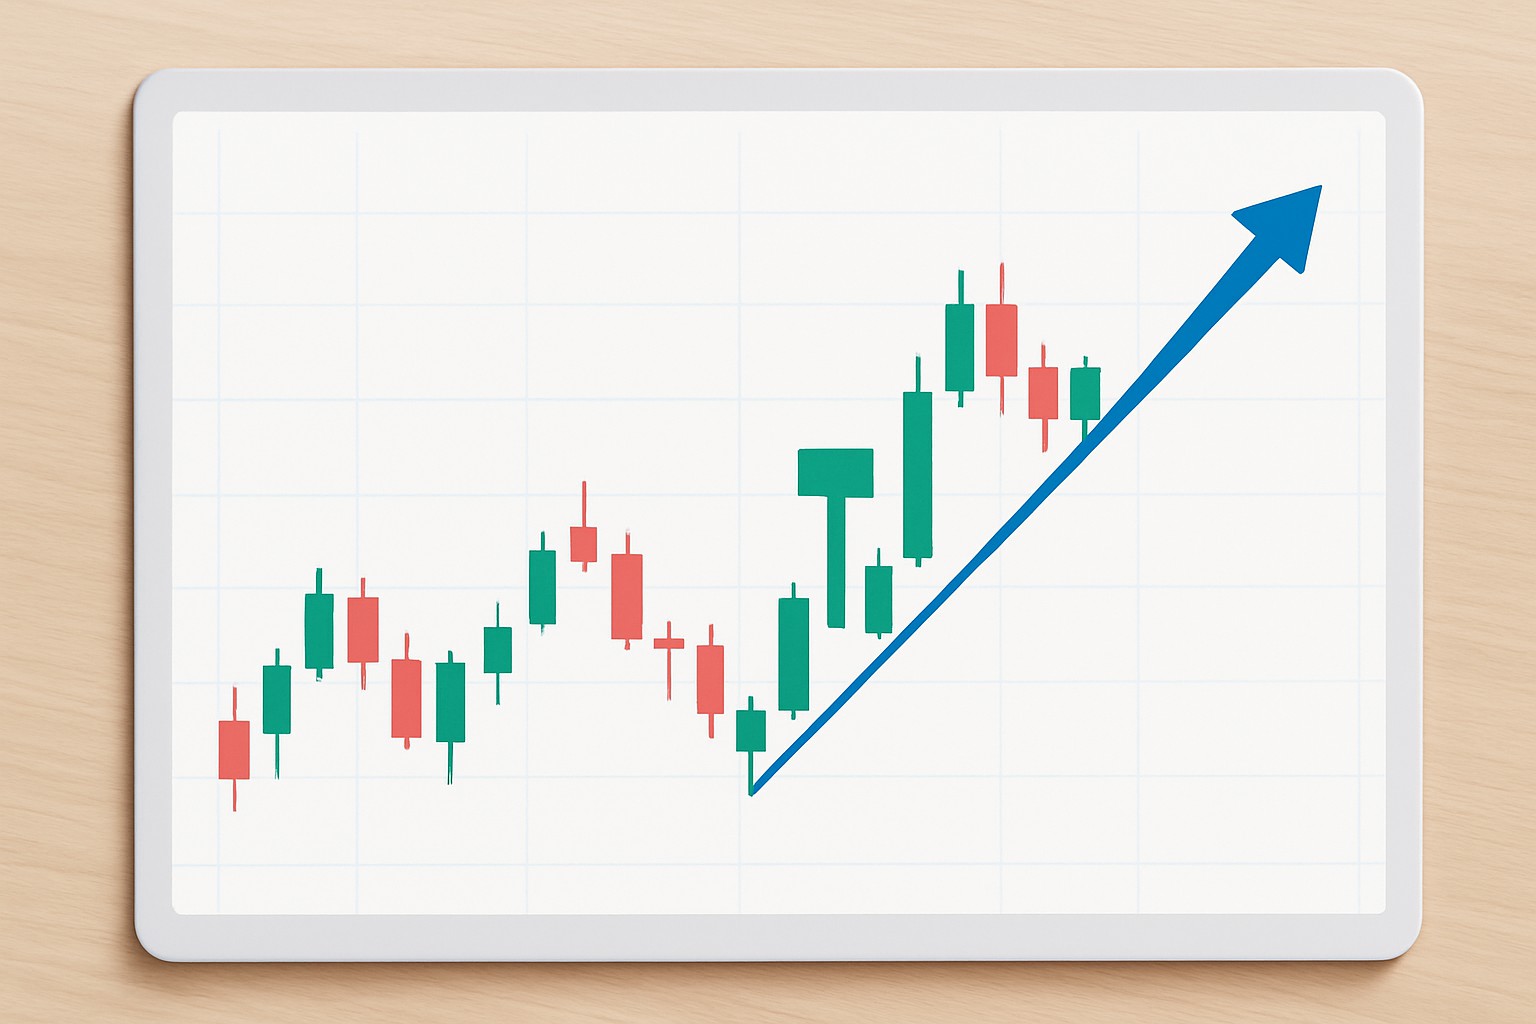
Technical Analysis
90 articles
Utilize chart patterns, indicators, and price action to identify trends and entry/exit points.
Profiting from Head and Shoulders Patterns in Any Market
Unlock the power of the head and shoulders pattern with this complete guide. Learn to spot, trade, and profit from key market reversals across stocks, forex, crypto, and commodities.


IOU Meaning in Finance
Discover what IOUs mean in finance, their role as informal debt acknowledgments, and how understanding them helps prevent financial misunderstandings.

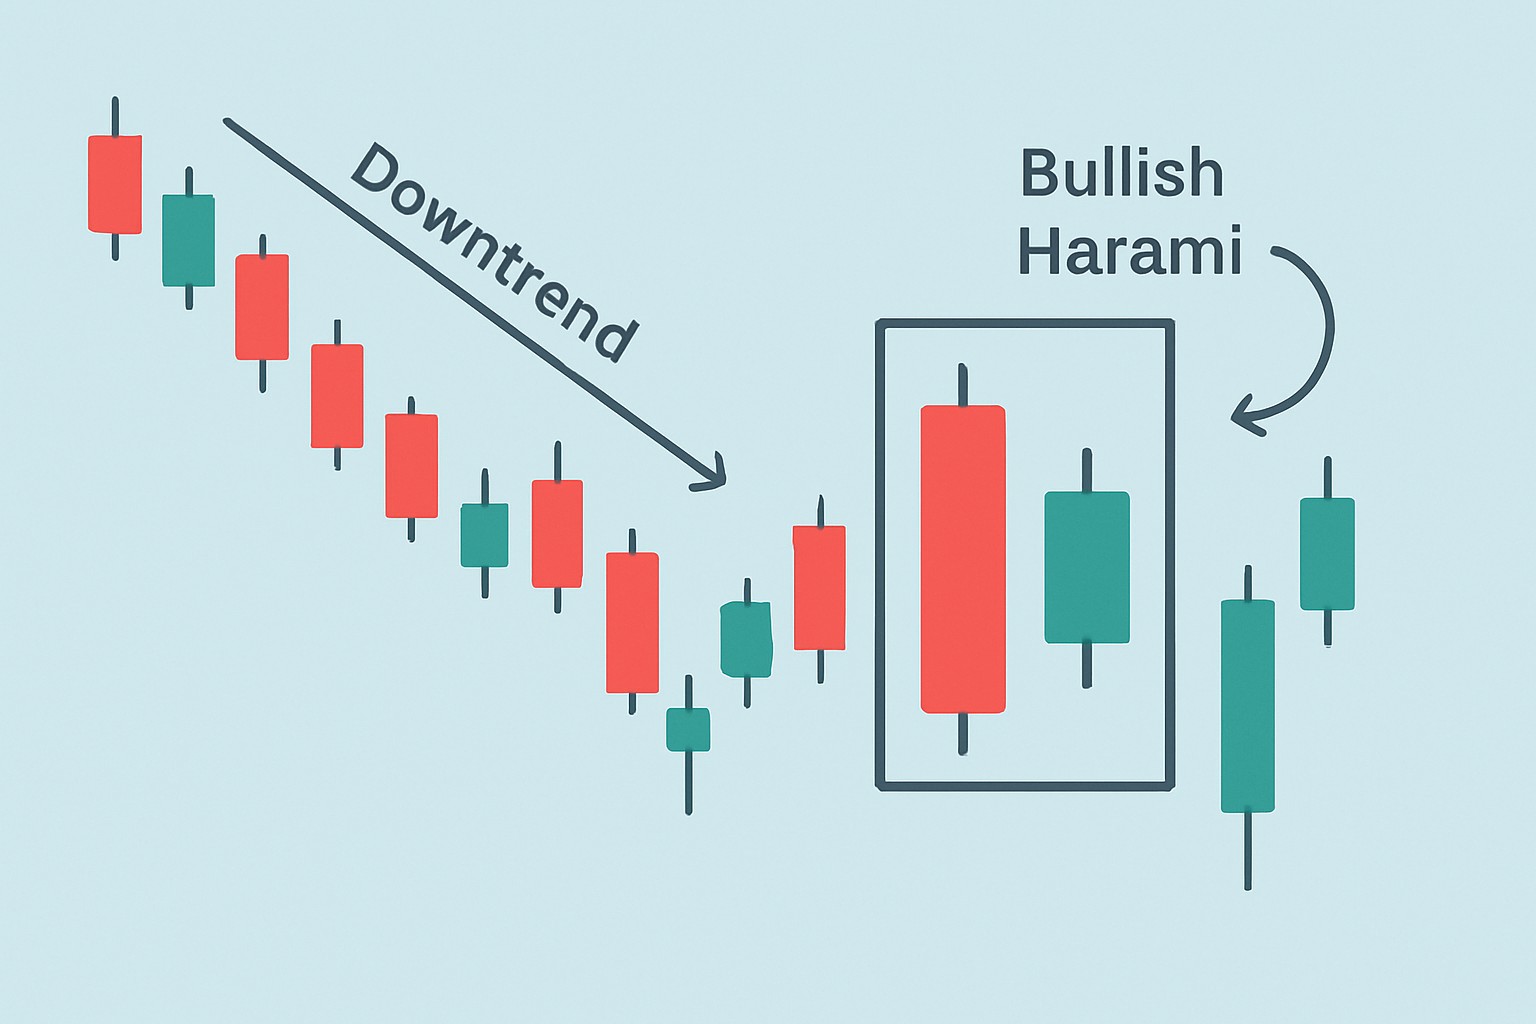
Understanding the Bullish Harami Candlestick Pattern
Discover the bullish harami candlestick pattern—a key technical signal that can hint at trend reversals. This article breaks down its features, identification steps, and how to trade it effectively.

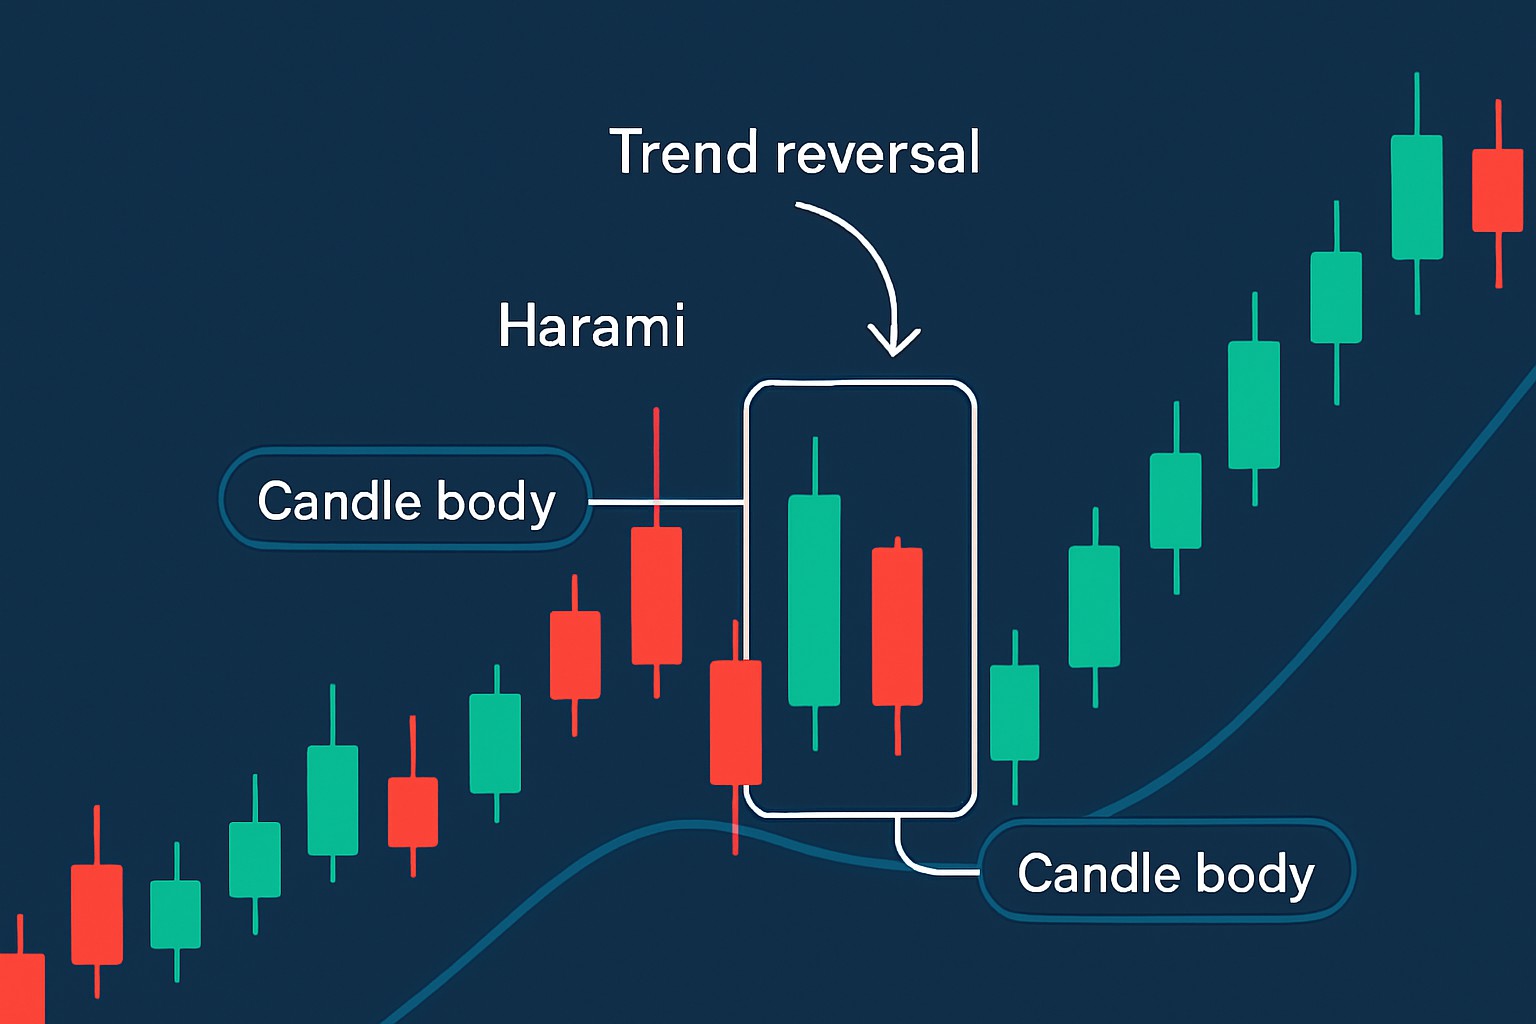
What is a Harami Pattern? Breaking It Down
Learn how the harami candlestick pattern signals potential market reversals. This guide breaks down recognition, significance, and practical trading use.

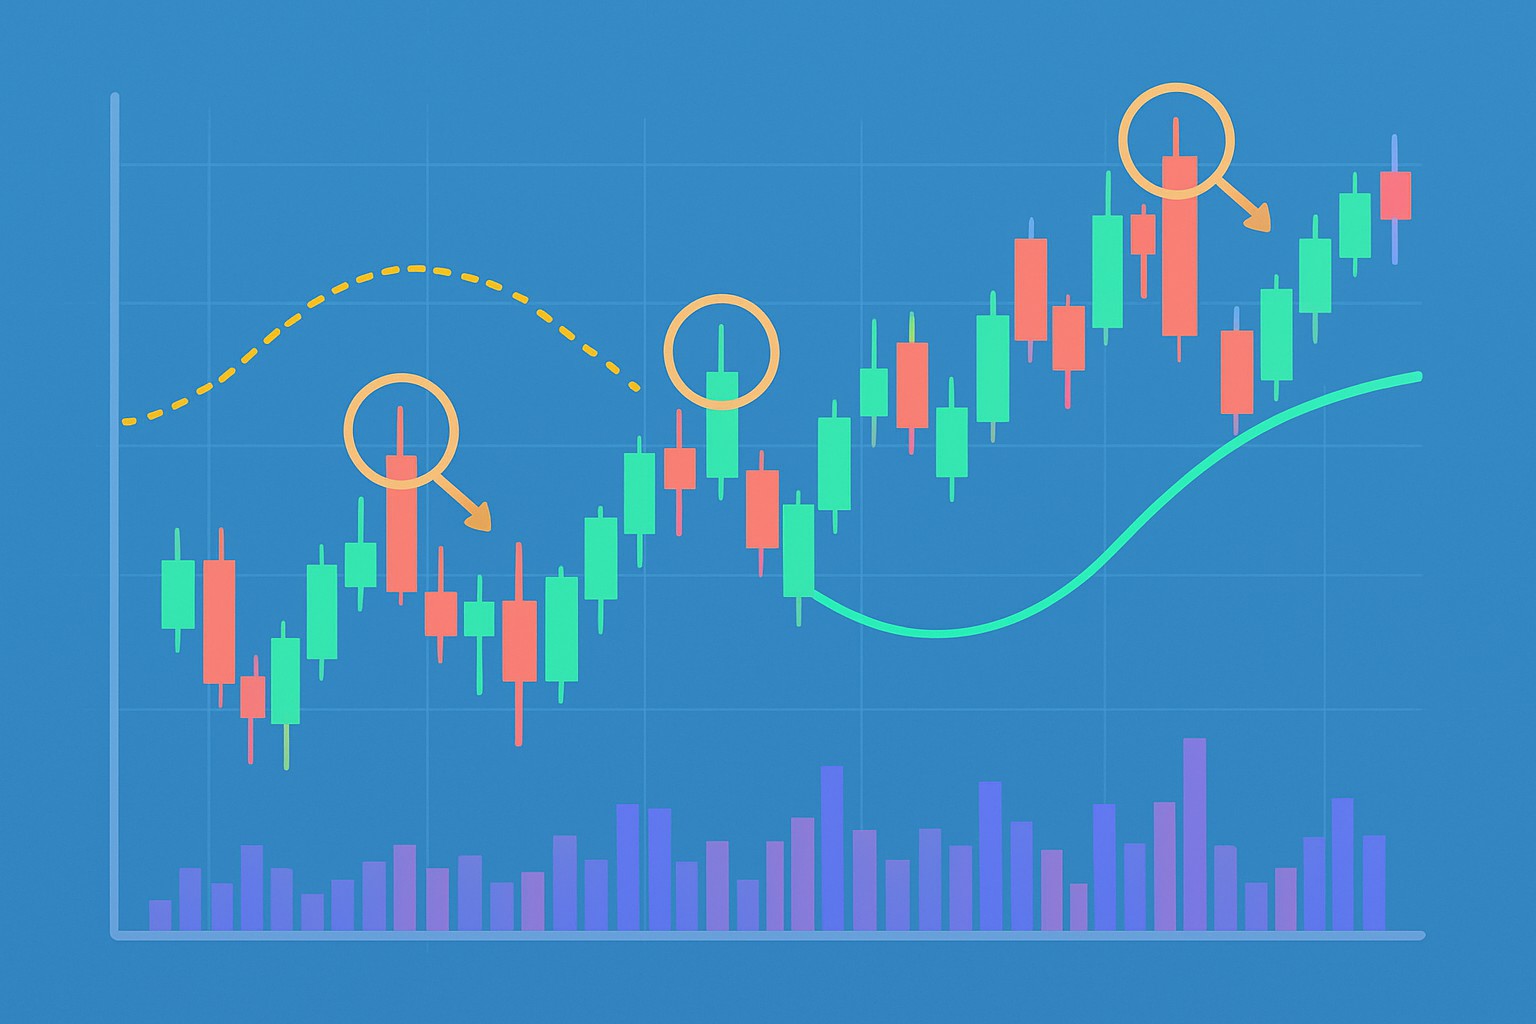
Most Important Candle Patterns Every Trader Should Know
Unlock the power of candle patterns to decode market psychology and improve your trading precision. This guide covers foundational and advanced formations to elevate your technical analysis skills.


Master the Bear Flag Setup
Unlock the power of the bear flag pattern with our practical, step-by-step guide. Understand market psychology and trade with confidence using proven technical analysis strategies.
How to Spot a Hammer Candlestick in Trading Charts
Master the hammer candlestick pattern—a key indicator for market reversals. This beginner-friendly guide breaks down what to look for and how to use this signal with confidence.
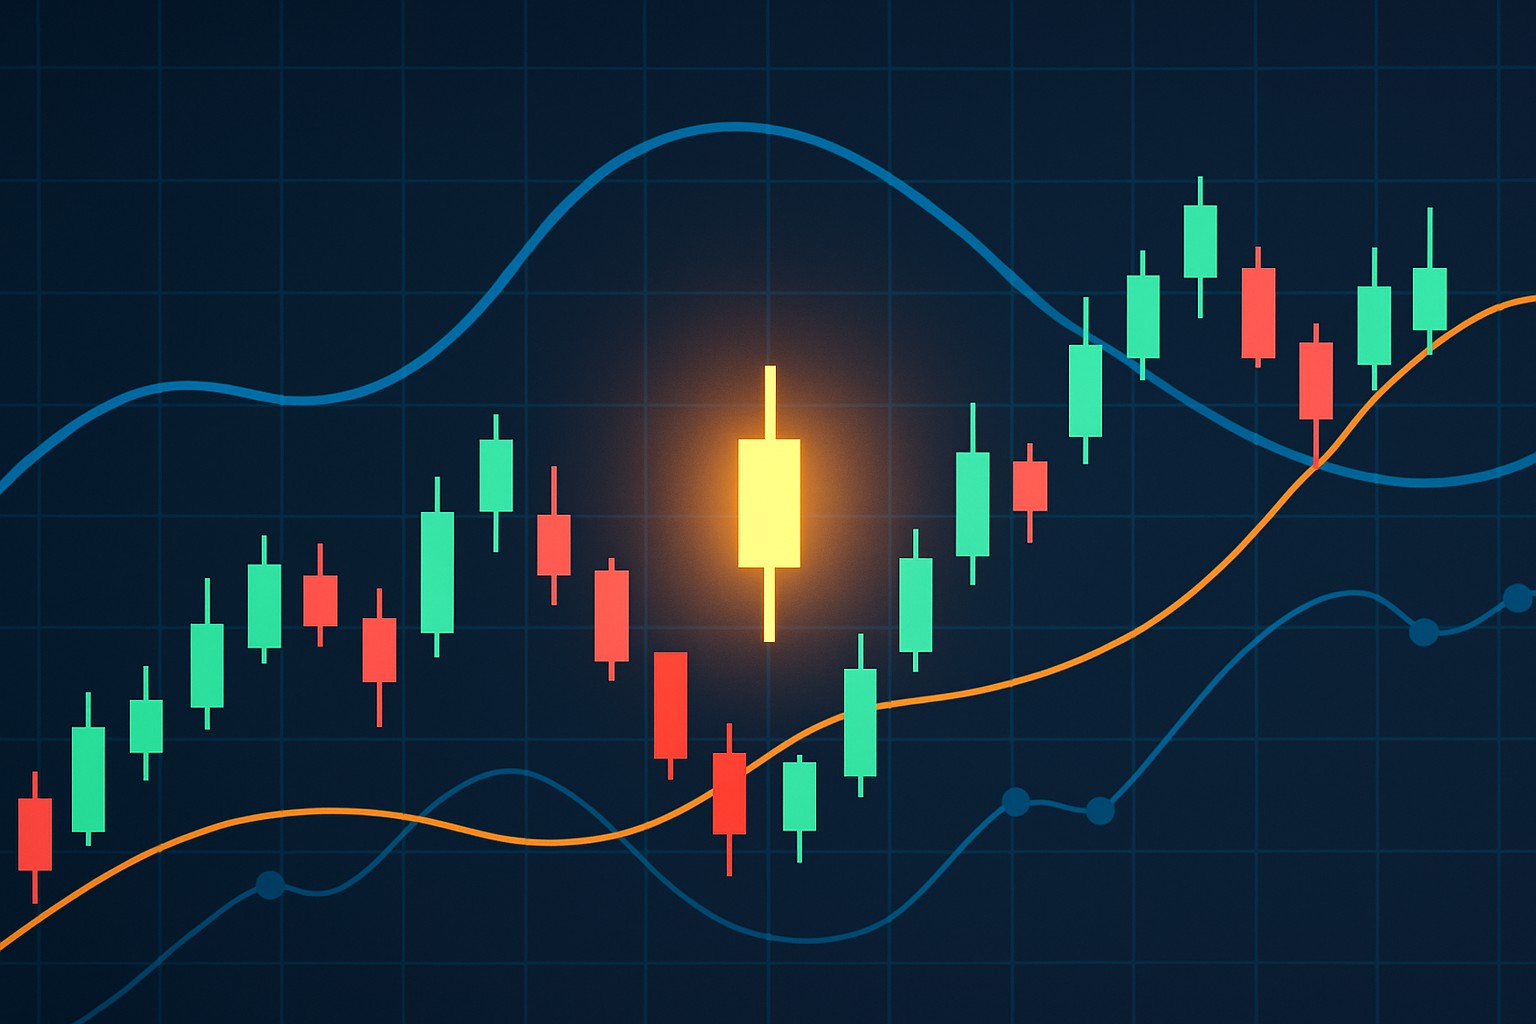
What the Doji Candlestick Means in Price Action
Discover the doji candlestick—a powerful price action signal revealing market indecision. This beginner's guide breaks down its meaning and how you can identify trend changes confidently.
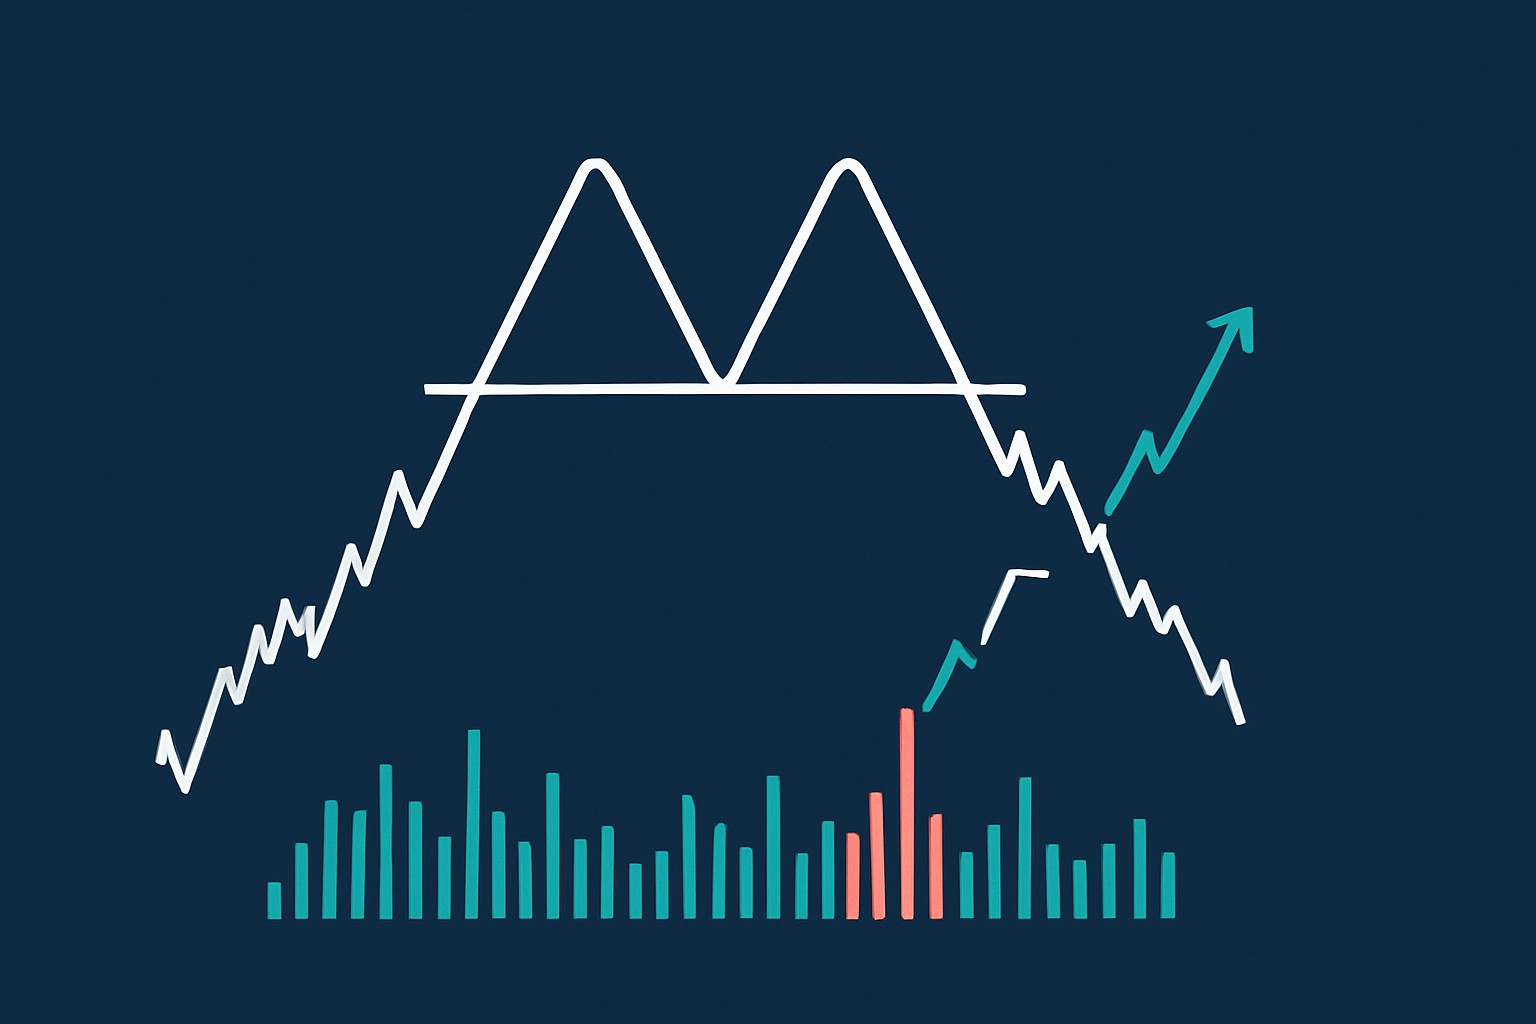
What Is a Double Top Pattern in Trading?
Discover how the double top pattern signals potential trend reversals in trading. Learn to identify, confirm, and trade this key technical analysis formation with confidence.
Understanding the Doji Candlestick
Discover how the doji candlestick reveals moments of market indecision and learn to use these signals effectively to make informed trading decisions.

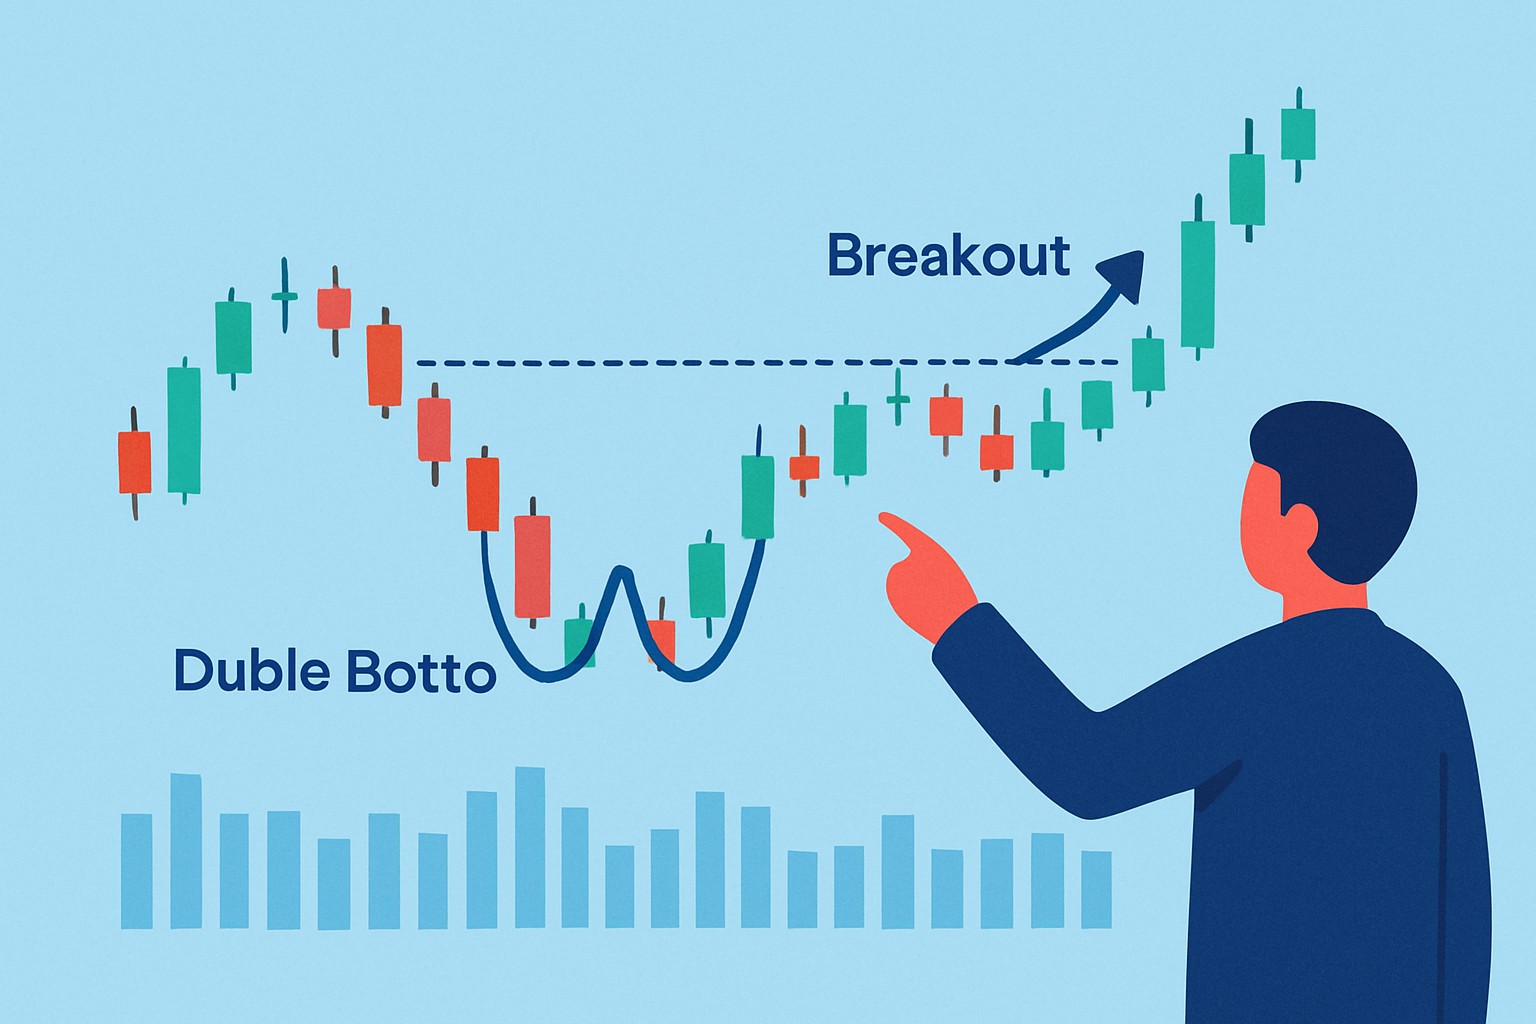
How to Trade the Double Bottom Pattern
Unlock the power of the double bottom pattern to spot bullish trend reversals. Understand its structure, confirmation techniques, and trading strategies in simple terms.
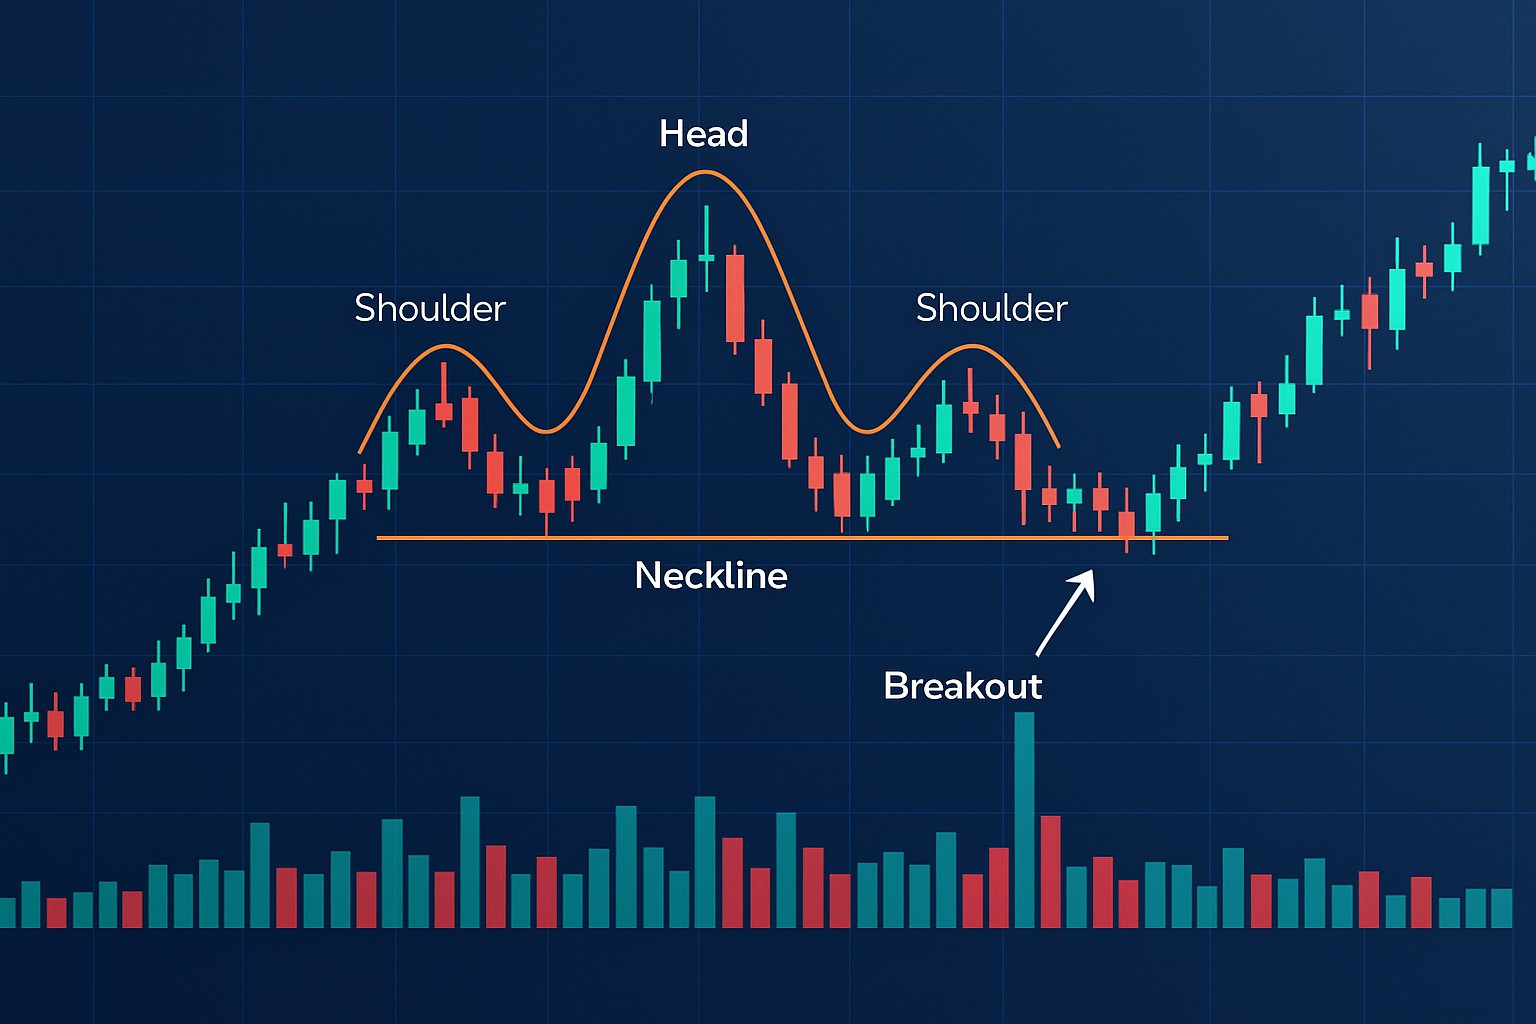
How to Spot the Head and Shoulders Chart Pattern
Discover how to confidently spot the head and shoulders chart pattern—a key indicator for trend reversals—and apply it effectively to boost your trading strategy.
