
Technical Analysis
84 articles
Utilize chart patterns, indicators, and price action to identify trends and entry/exit points.
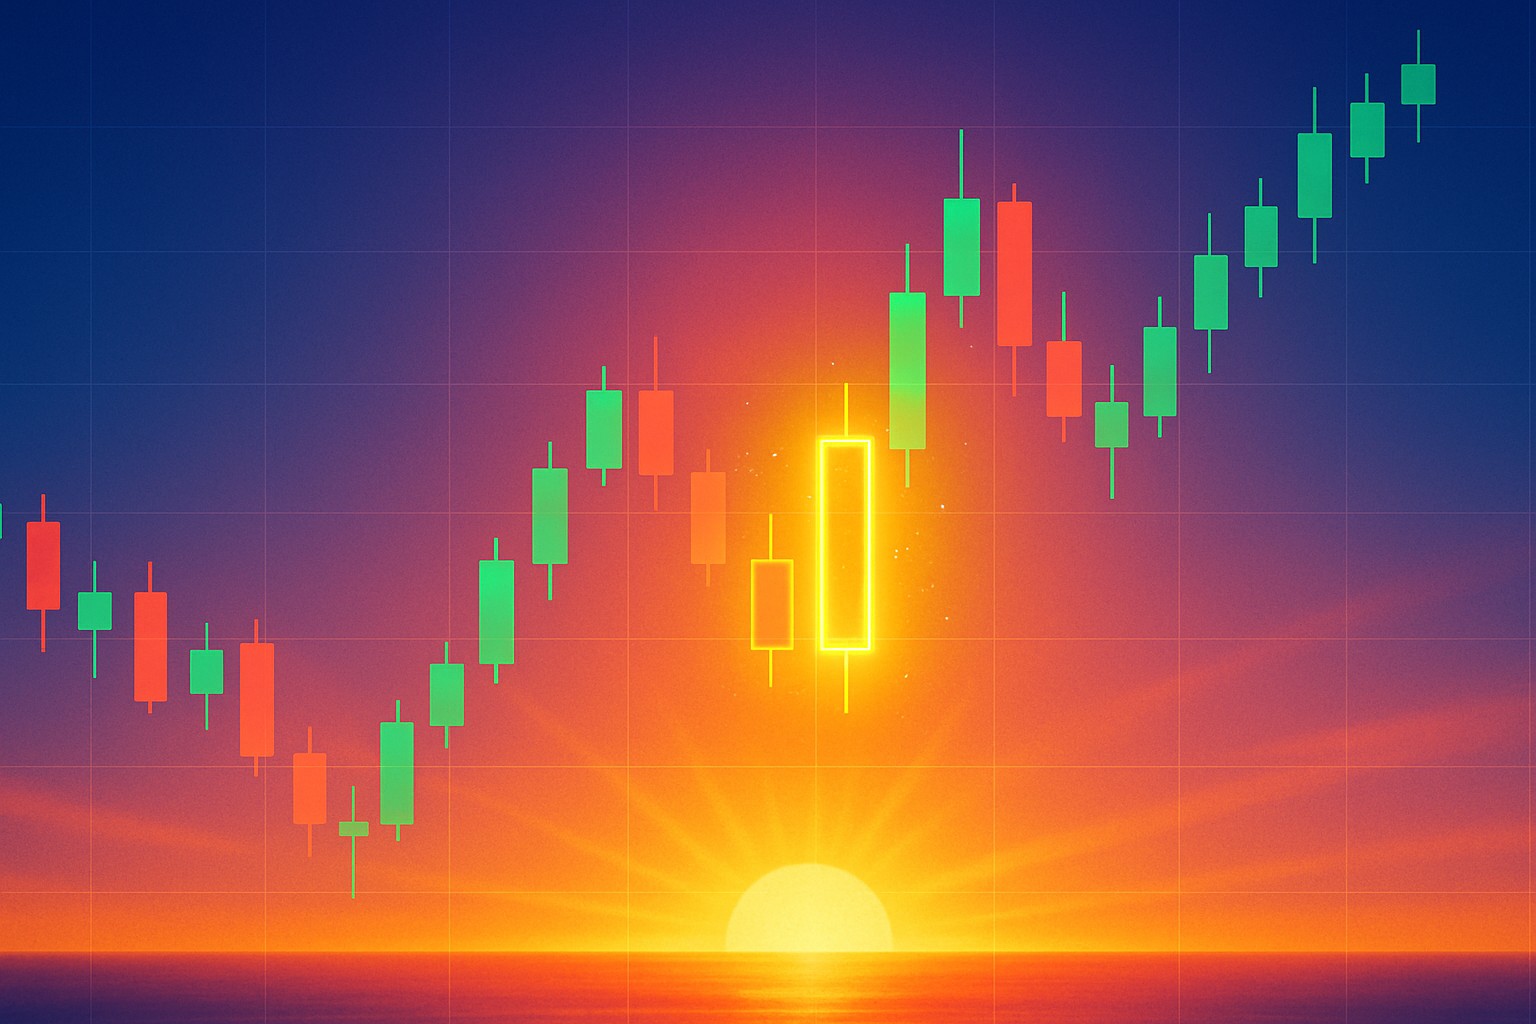
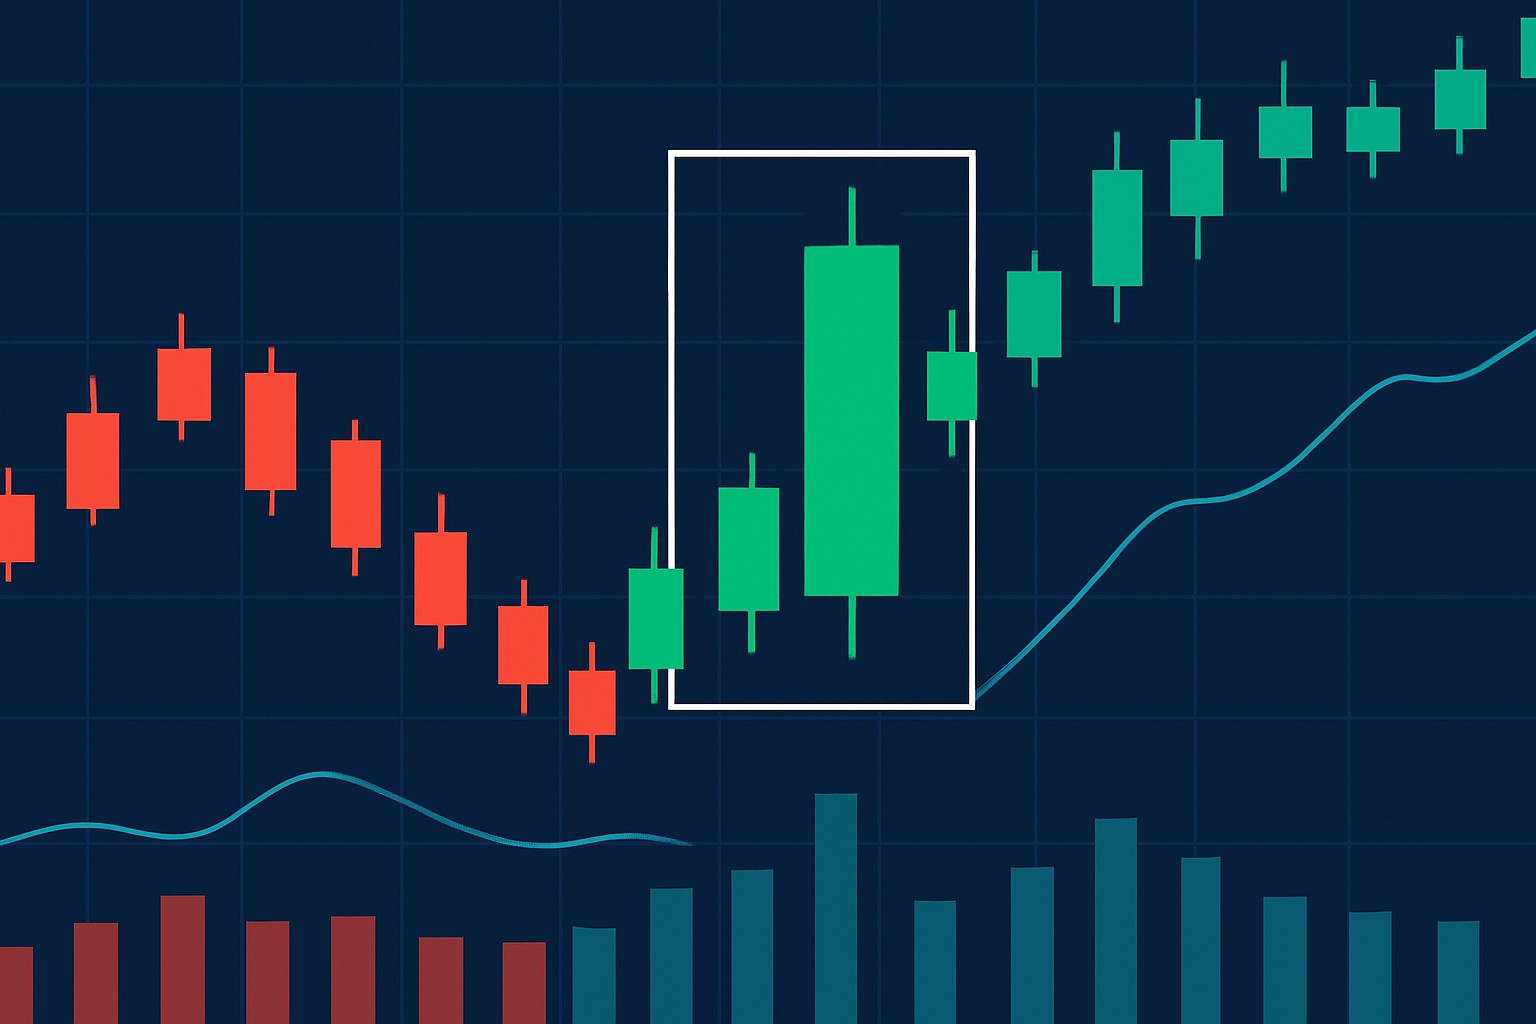
How to Identify and Trade the Morning Star Candlestick Formation
Discover how the morning star candlestick pattern reveals bullish reversals. This guide helps traders identify it clearly and trade with confidence.

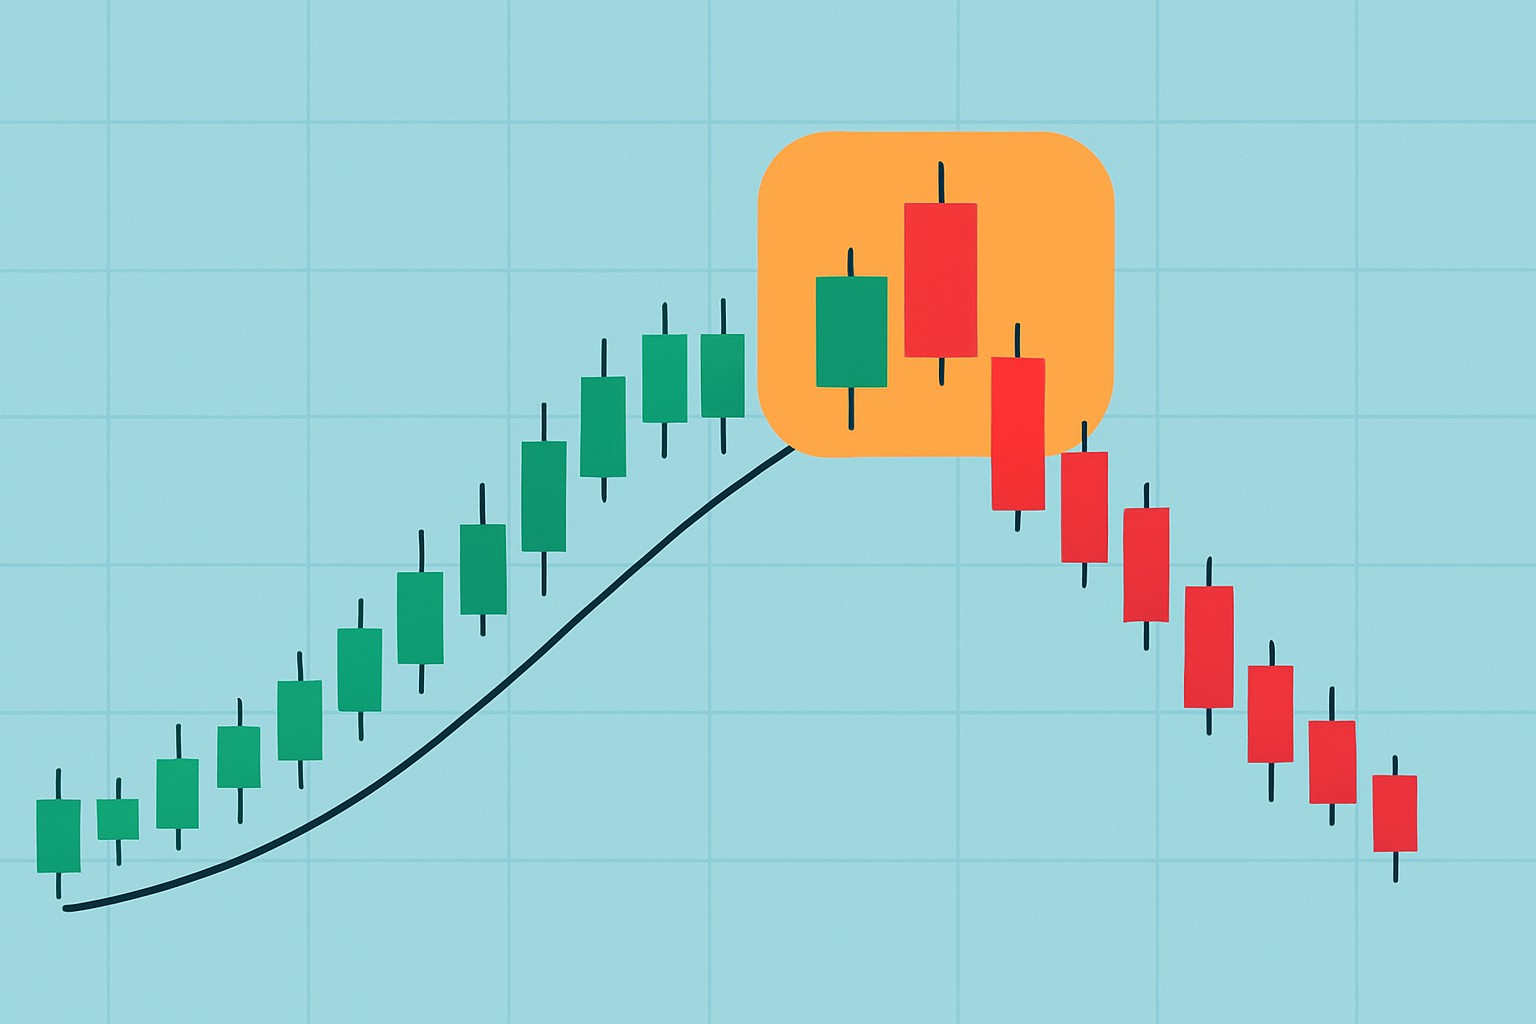
Understanding The Bearish Engulfing Candlestick Pattern
Discover how the bearish engulfing candle pattern signals potential market reversals and learn practical strategies to use it effectively in your trading.

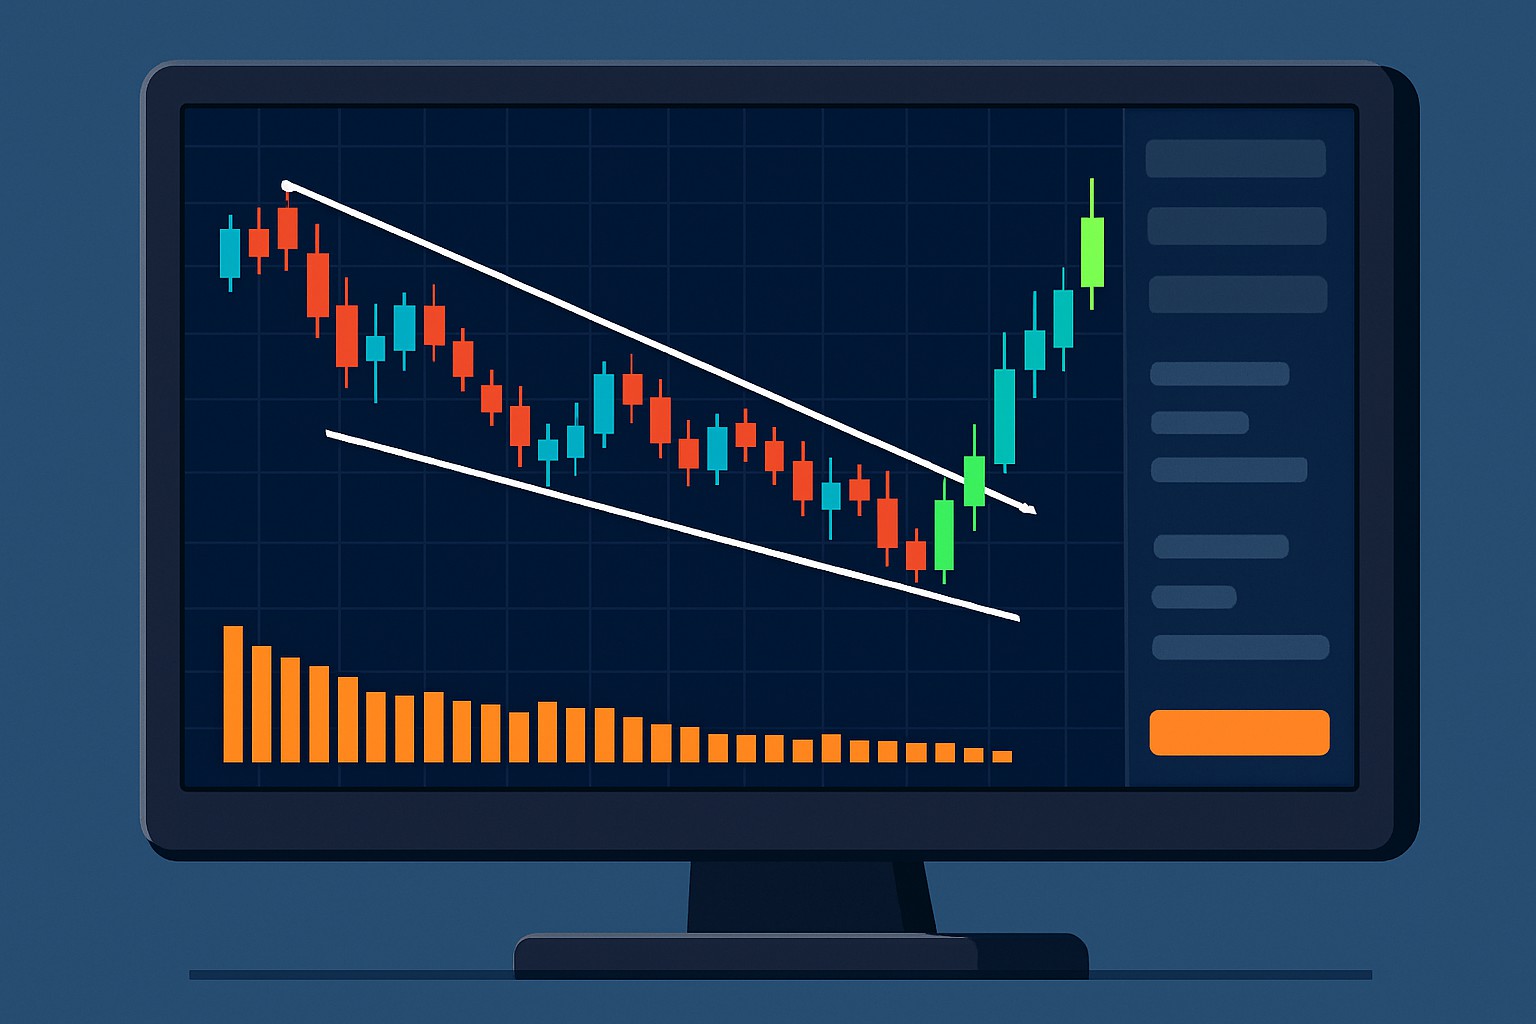
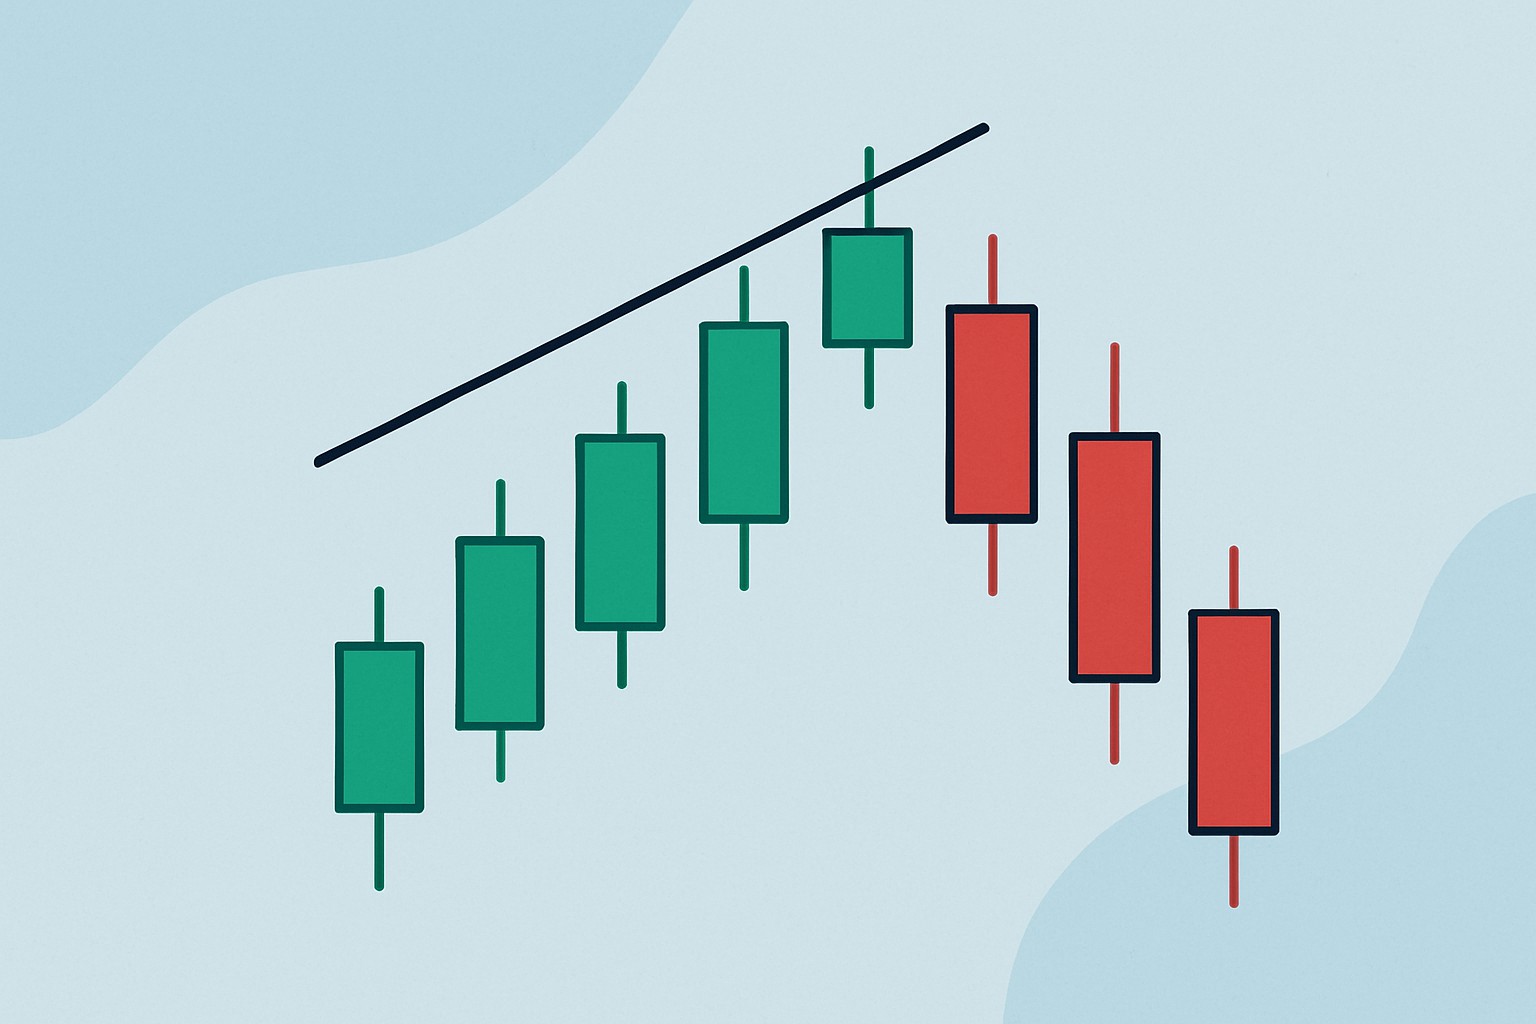
Descending Wedge Explained for Spotting Bullish Reversals
Discover the descending wedge pattern—a key technical tool that helps traders spot bullish reversals early. This guide simplifies the concept, breaking down how to identify and trade this powerful chart pattern confidently.

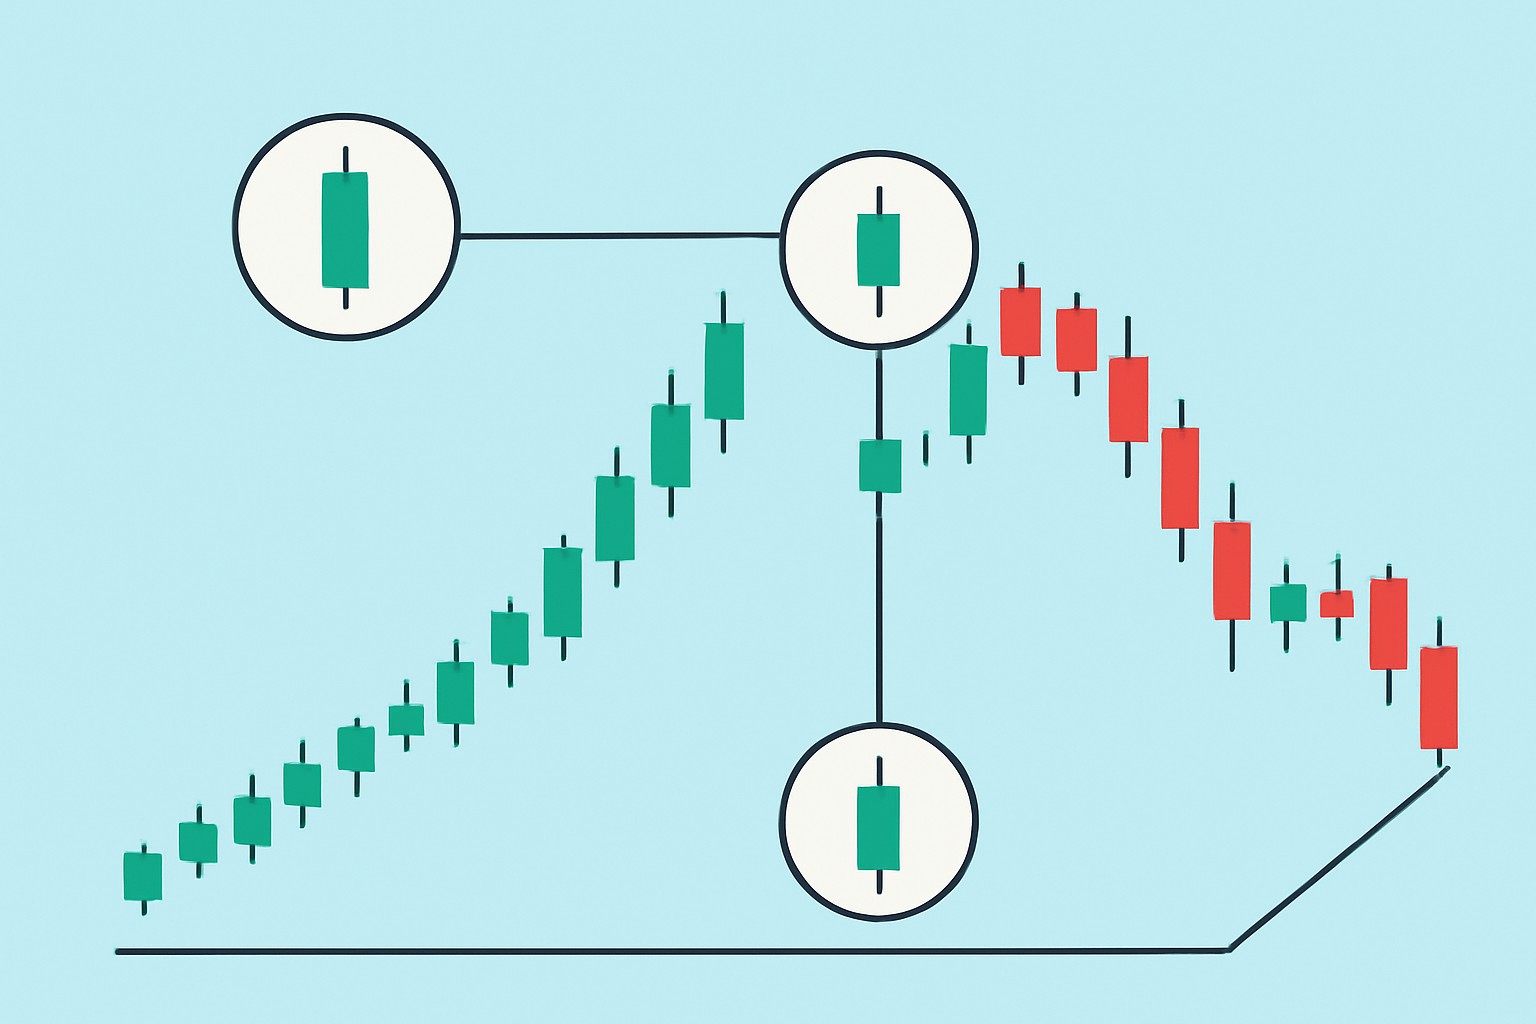
Candlestick types to spot trends and reversals faster
Mastering key candlestick types can help beginners spot market trends and reversals faster, enabling smarter and more confident trading decisions.

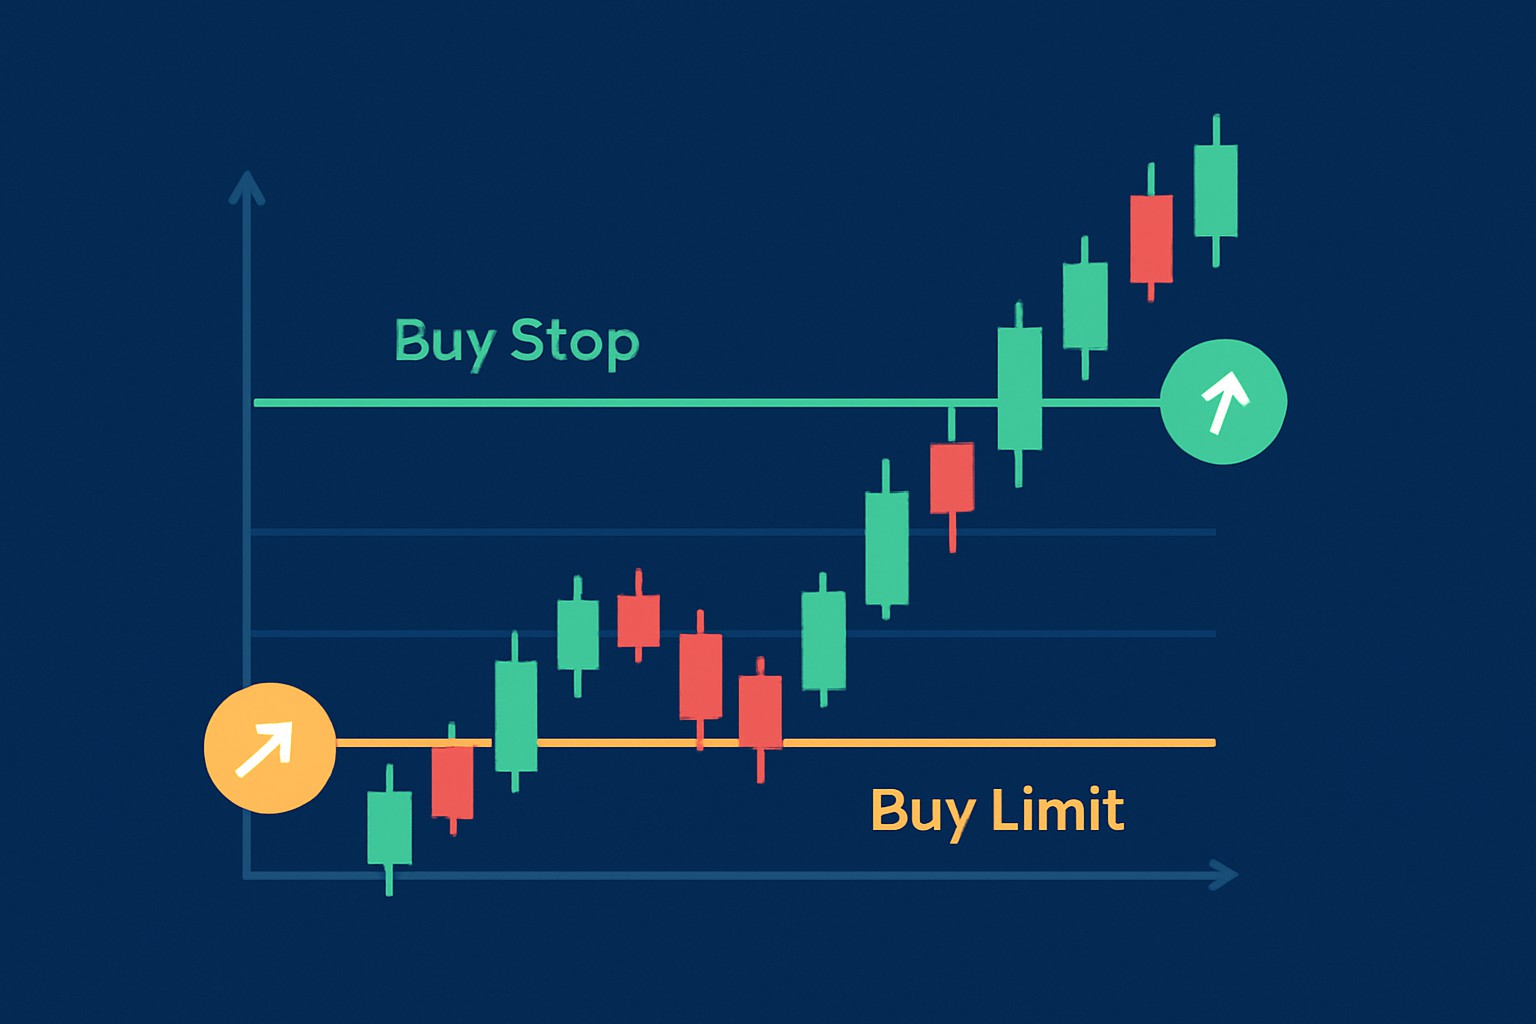
Buy limit vs buy stop - what's the difference?
Discover the essential differences between buy limit and buy stop orders and learn which is best for your trading strategy. From execution mechanics to risk management, gain clear insights to optimize your trade entries.
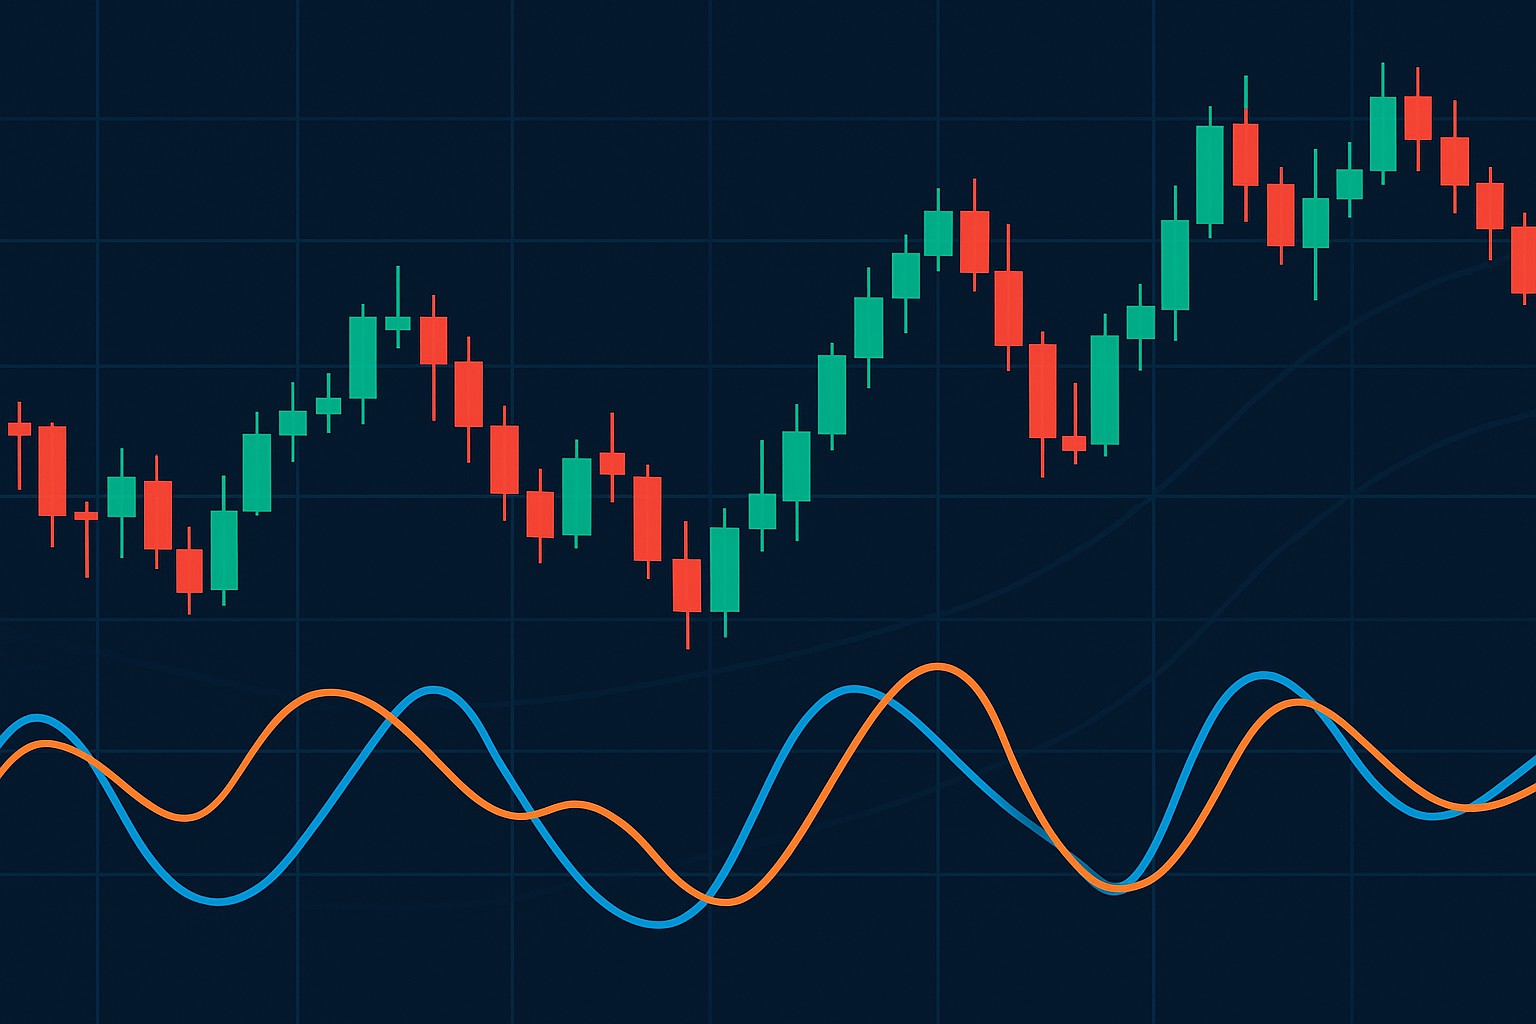
How to Spot Momentum Shifts Using Relative Vigor Index
Spotting momentum shifts early with the Relative Vigor Index empowers traders to time entries and exits more effectively, boosting profitability and confidence in their trading strategies.

How The Engulfing Candle Pattern Signals Reversals
Discover how the engulfing candle pattern acts as a powerful reversal signal in technical analysis. This guide breaks down its identification, psychology, and practical trading uses.

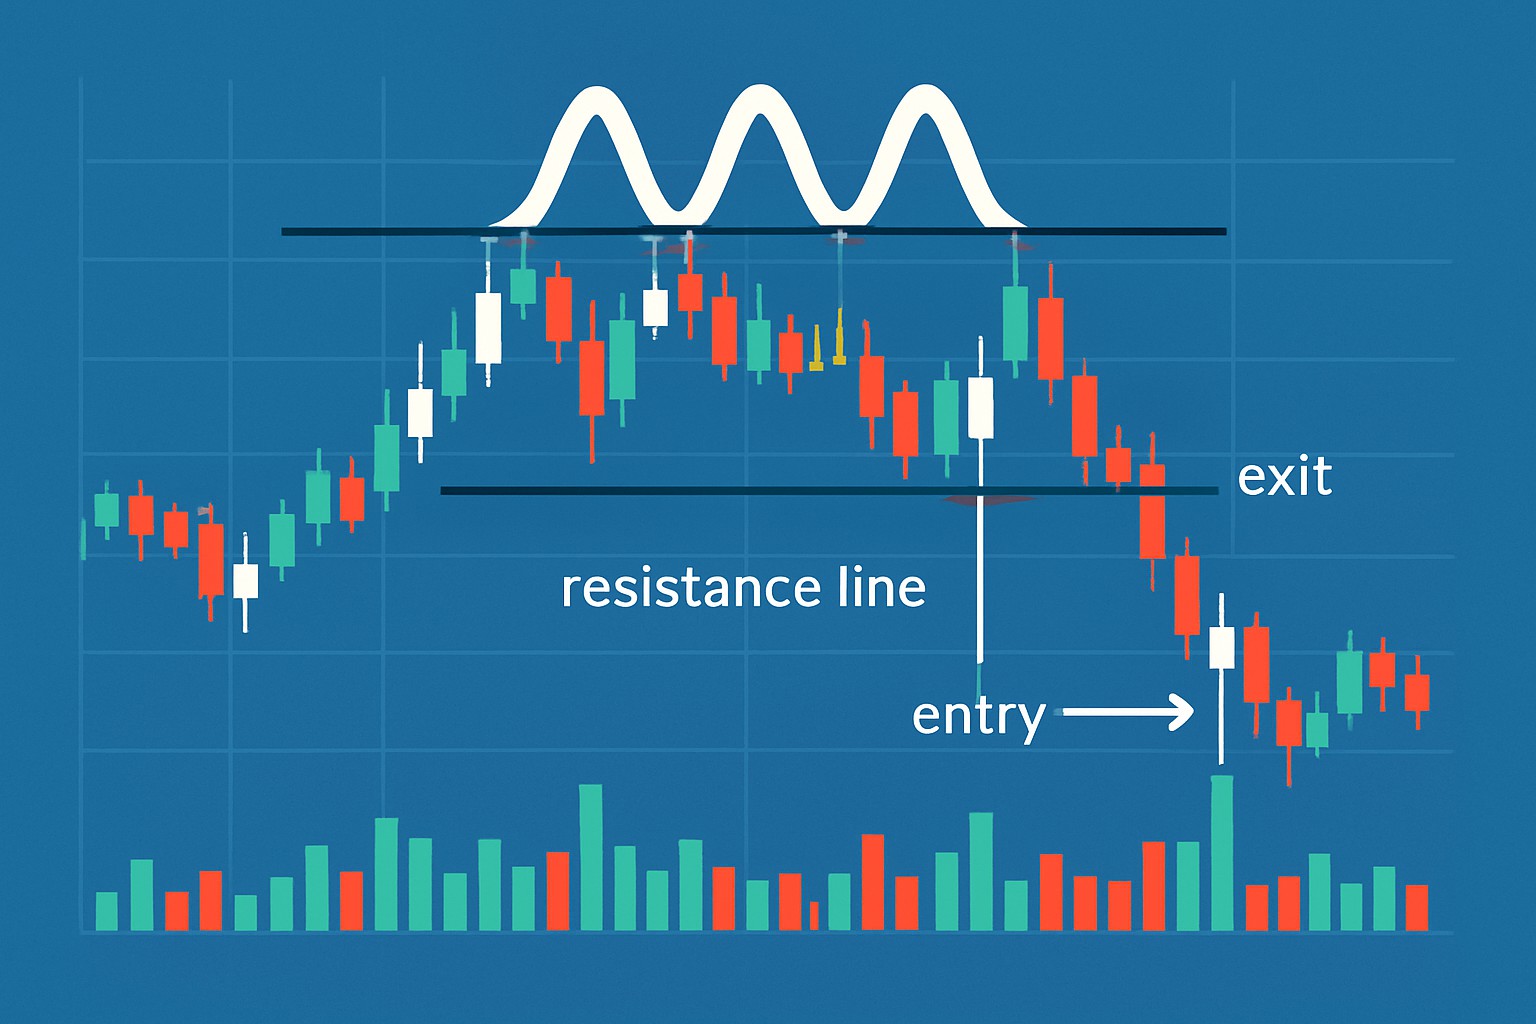
How to Spot a Triple Top Pattern in Your Charts
Discover how to spot the triple top pattern on your trading charts with our detailed, beginner-friendly guide, helping you anticipate trend reversals and improve your trading strategy.

Trading the Three Black Crows Pattern
Discover how the Three Black Crows candlestick pattern signals potential market reversals. This easy-to-understand guide covers its appearance, psychology, and trading tactics.

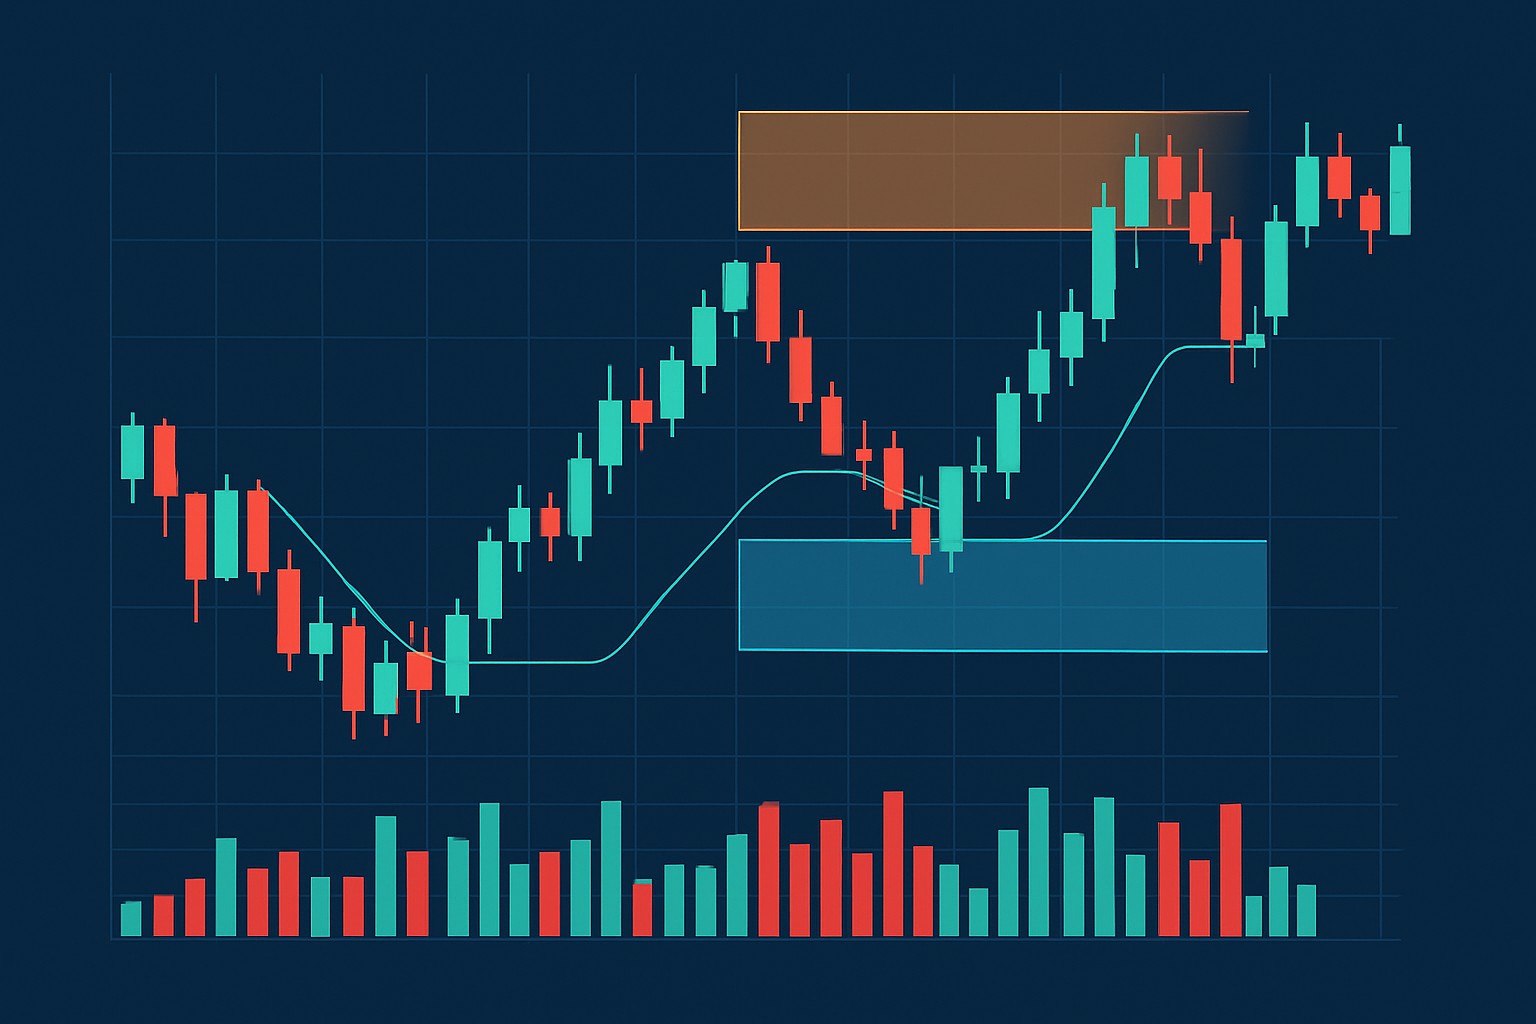
Why Order Block Patterns Matter in Technical Analysis
Discover how order block patterns reveal institutional footprints and enhance your trading edge by identifying pivotal price zones before big market moves.
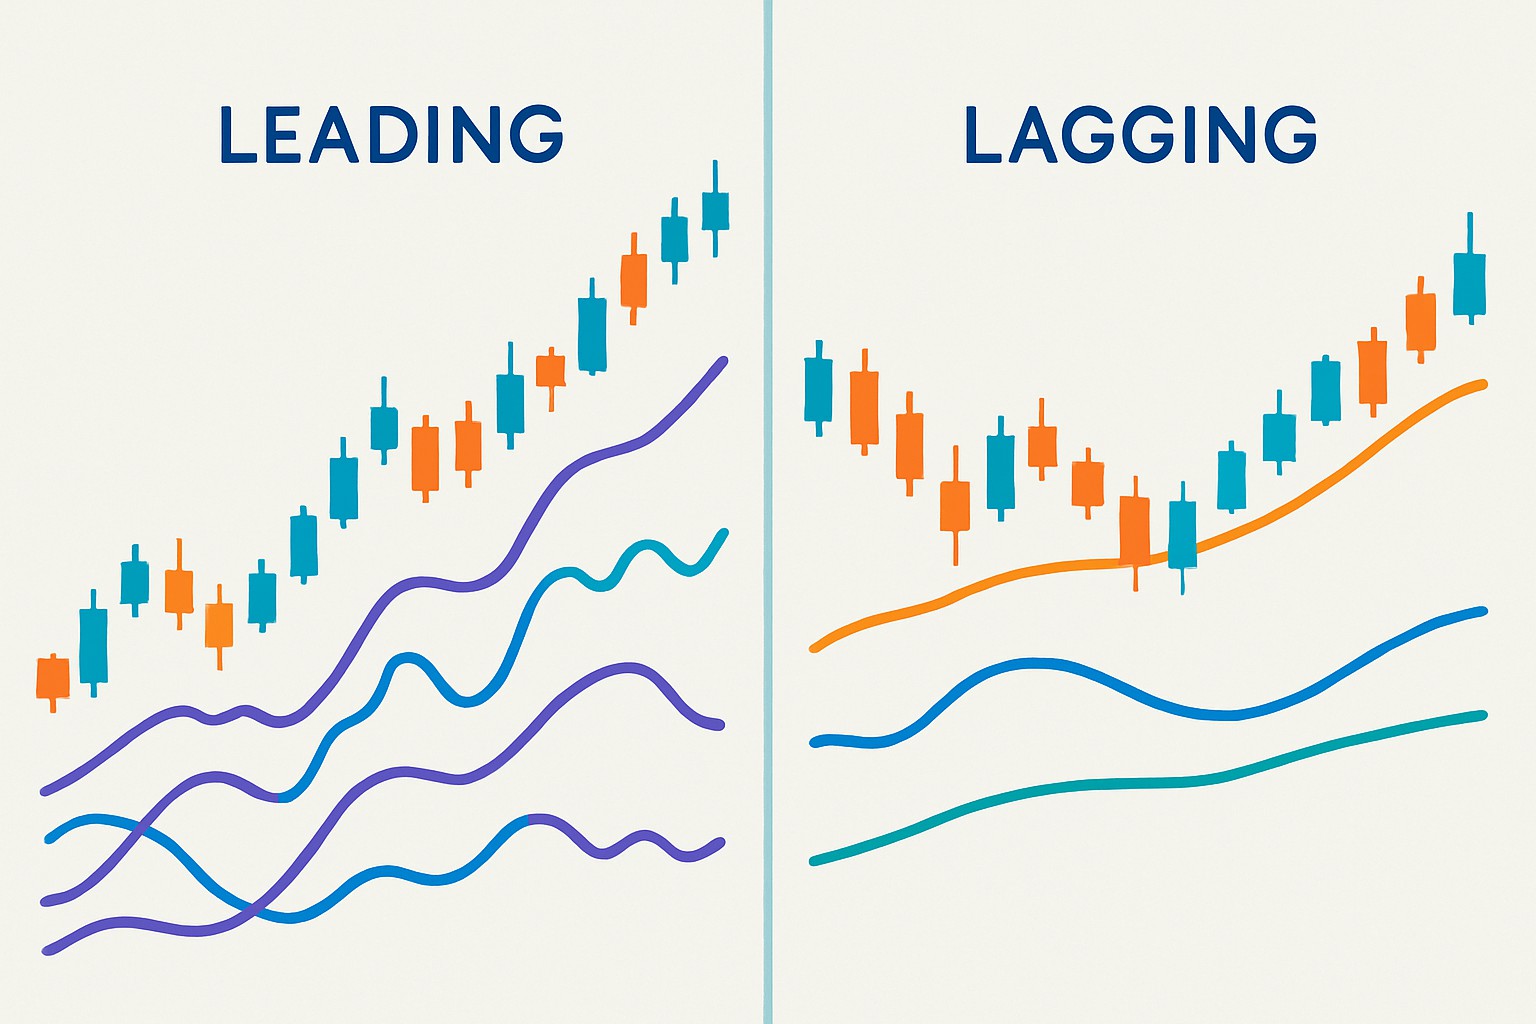
When to Use Leading vs Lagging Indicators for Signals
Master the art of timing your trades with a comprehensive guide on leading vs lagging indicators. Learn their strengths, weaknesses, and how to apply them for smarter market decisions.
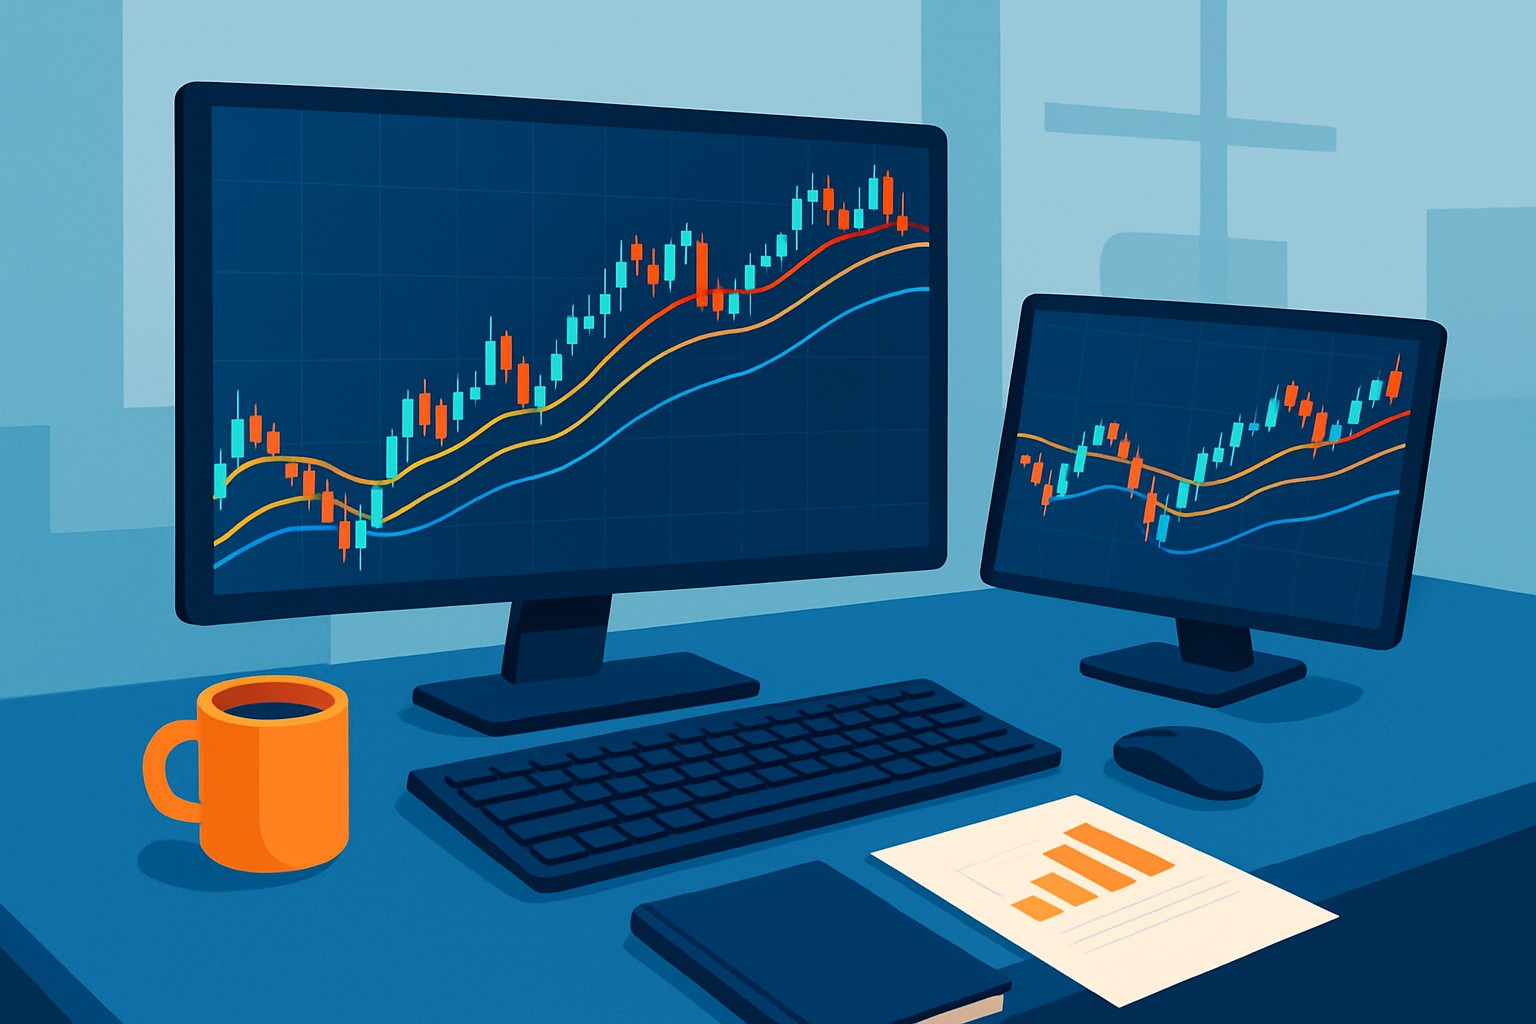
EMA Meaning and Why It Helps Spot Trend Direction
Understanding the EMA meaning empowers traders to identify market trends faster and with greater confidence. This article breaks down the Exponential Moving Average, explaining its calculation, usage, and common strategies.
