
Technical Analysis
90 articles
Utilize chart patterns, indicators, and price action to identify trends and entry/exit points.
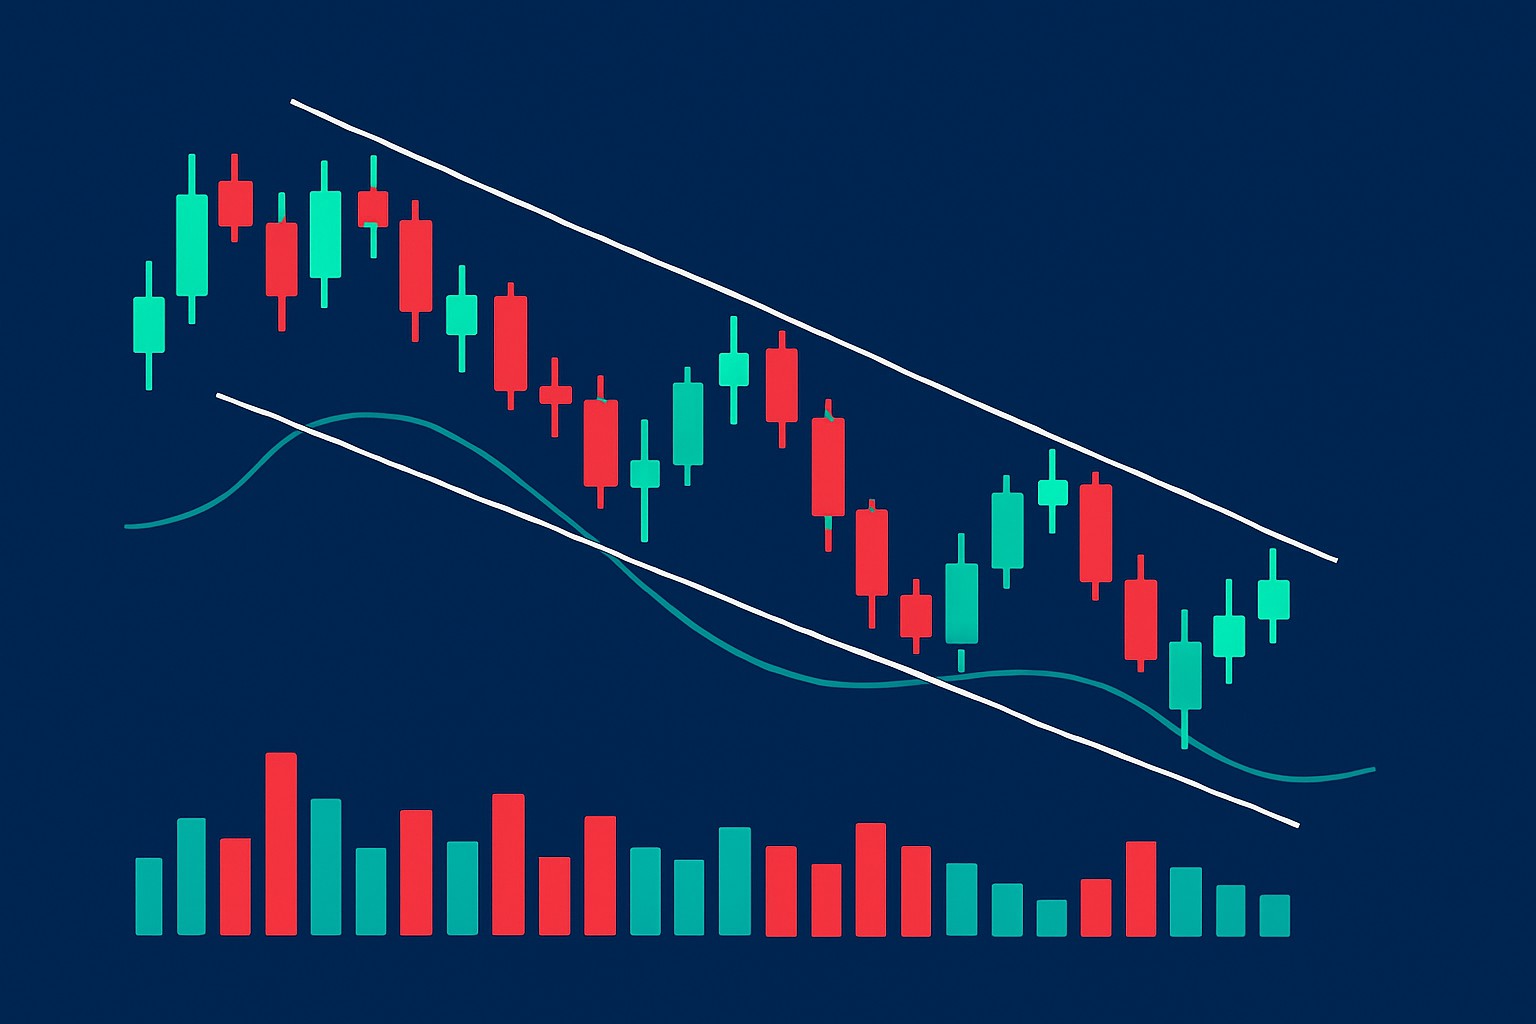
How to Identify the Falling Wedge Pattern in Charts
Master the falling wedge pattern with this comprehensive guide offering clear steps to identify, confirm, and trade this powerful technical analysis formation.

How to Read the Hammer Candlestick Pattern in Forex Trading
Discover how to spot and leverage the hammer candlestick pattern in forex trading. This guide breaks down its identification, interpretation, and integration with other tools for confident trading success.

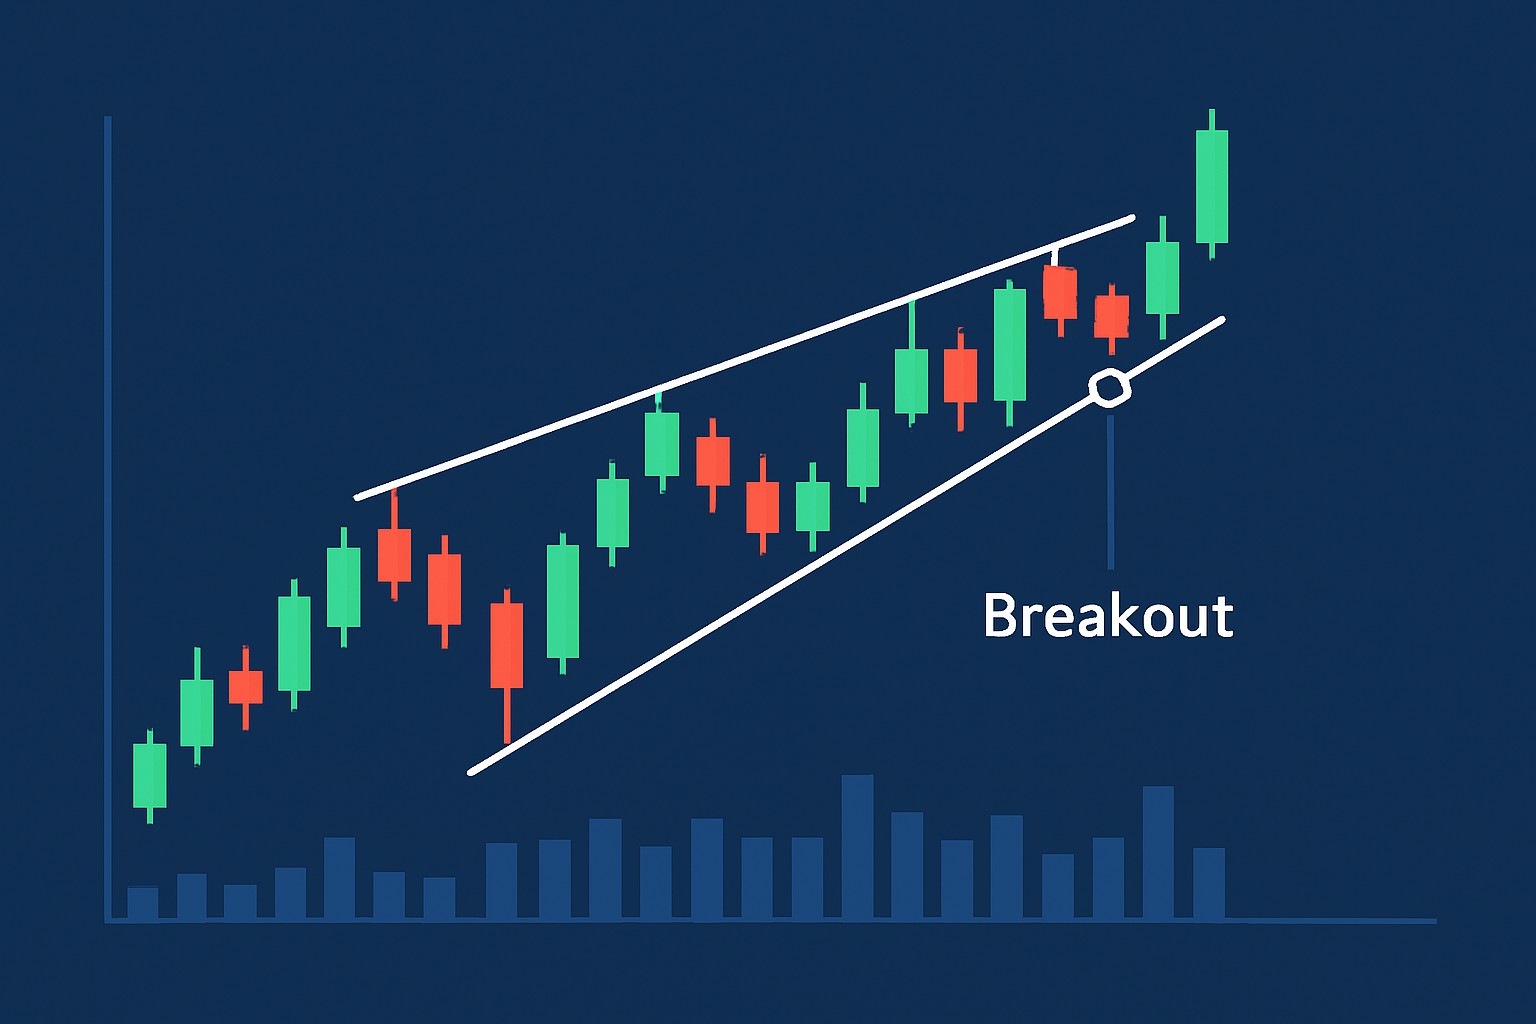
How to Spot a Rising Wedge Pattern in Trading Charts
Master the skill of spotting rising wedge patterns, a key technical analysis tool that helps traders predict bearish reversals and optimize their market strategies.

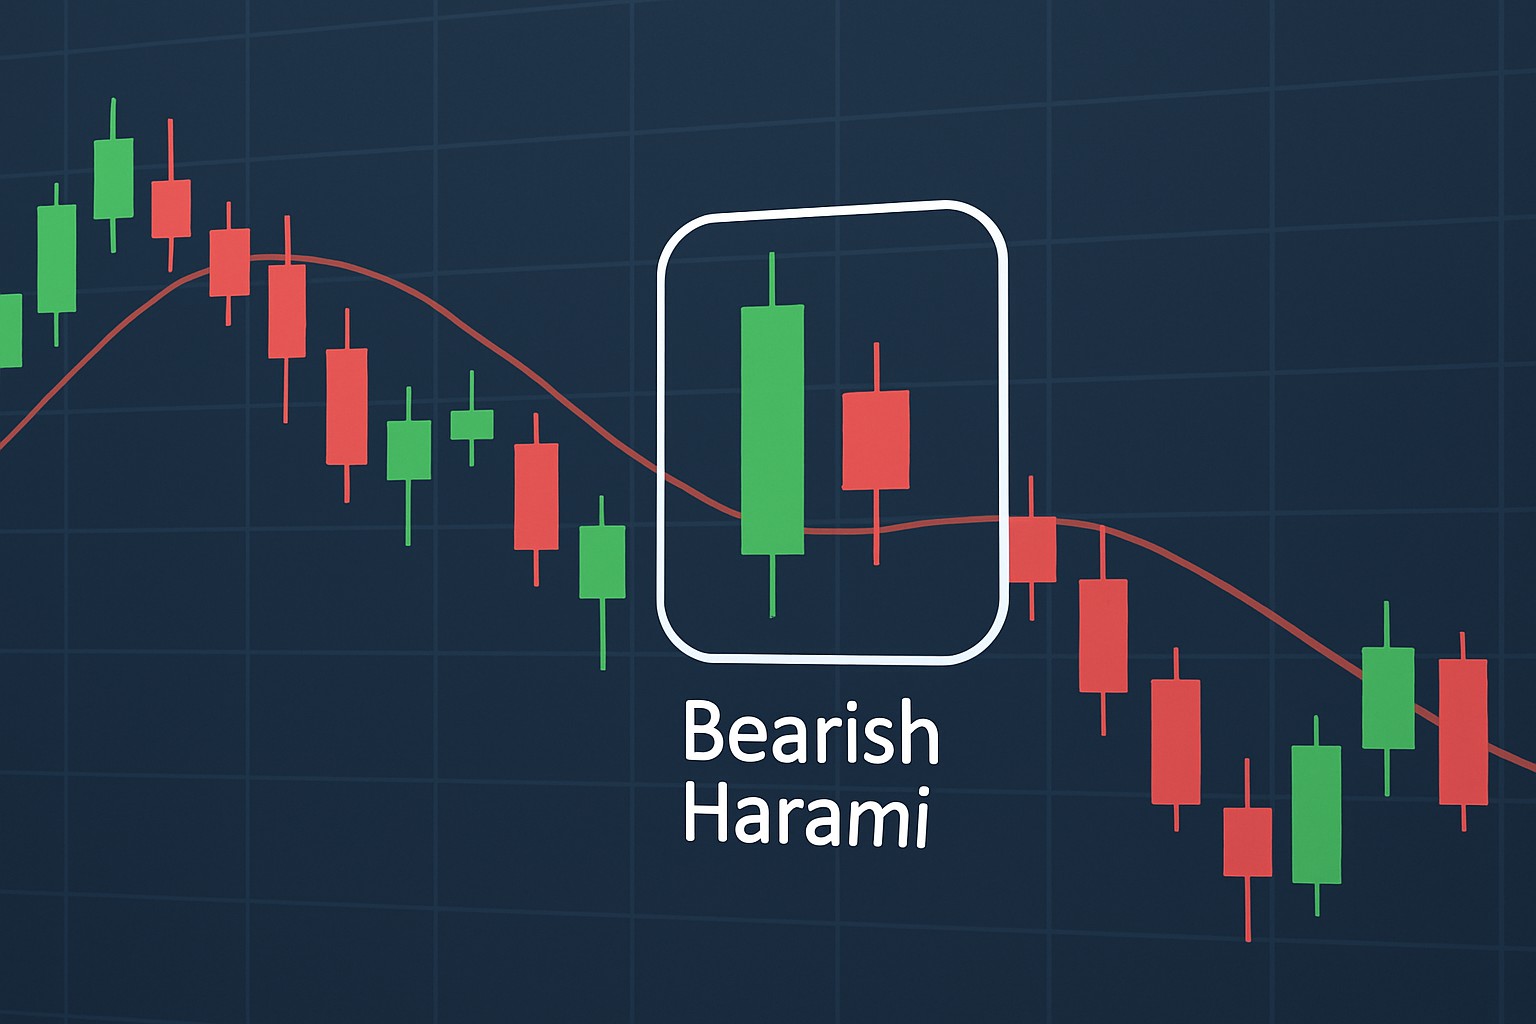
What the Bearish Harami Pattern Means for Your Trades
Discover how the bearish harami candlestick pattern can signal market reversals and help you make smarter trading choices. Learn to spot, confirm, and apply this pattern effectively.

Recognizing the inverted hammer candlestick in charts
Discover how the inverted hammer candlestick pattern can signal potential bullish reversals. This guide simplifies recognition, significance, and trading strategies for all experience levels.
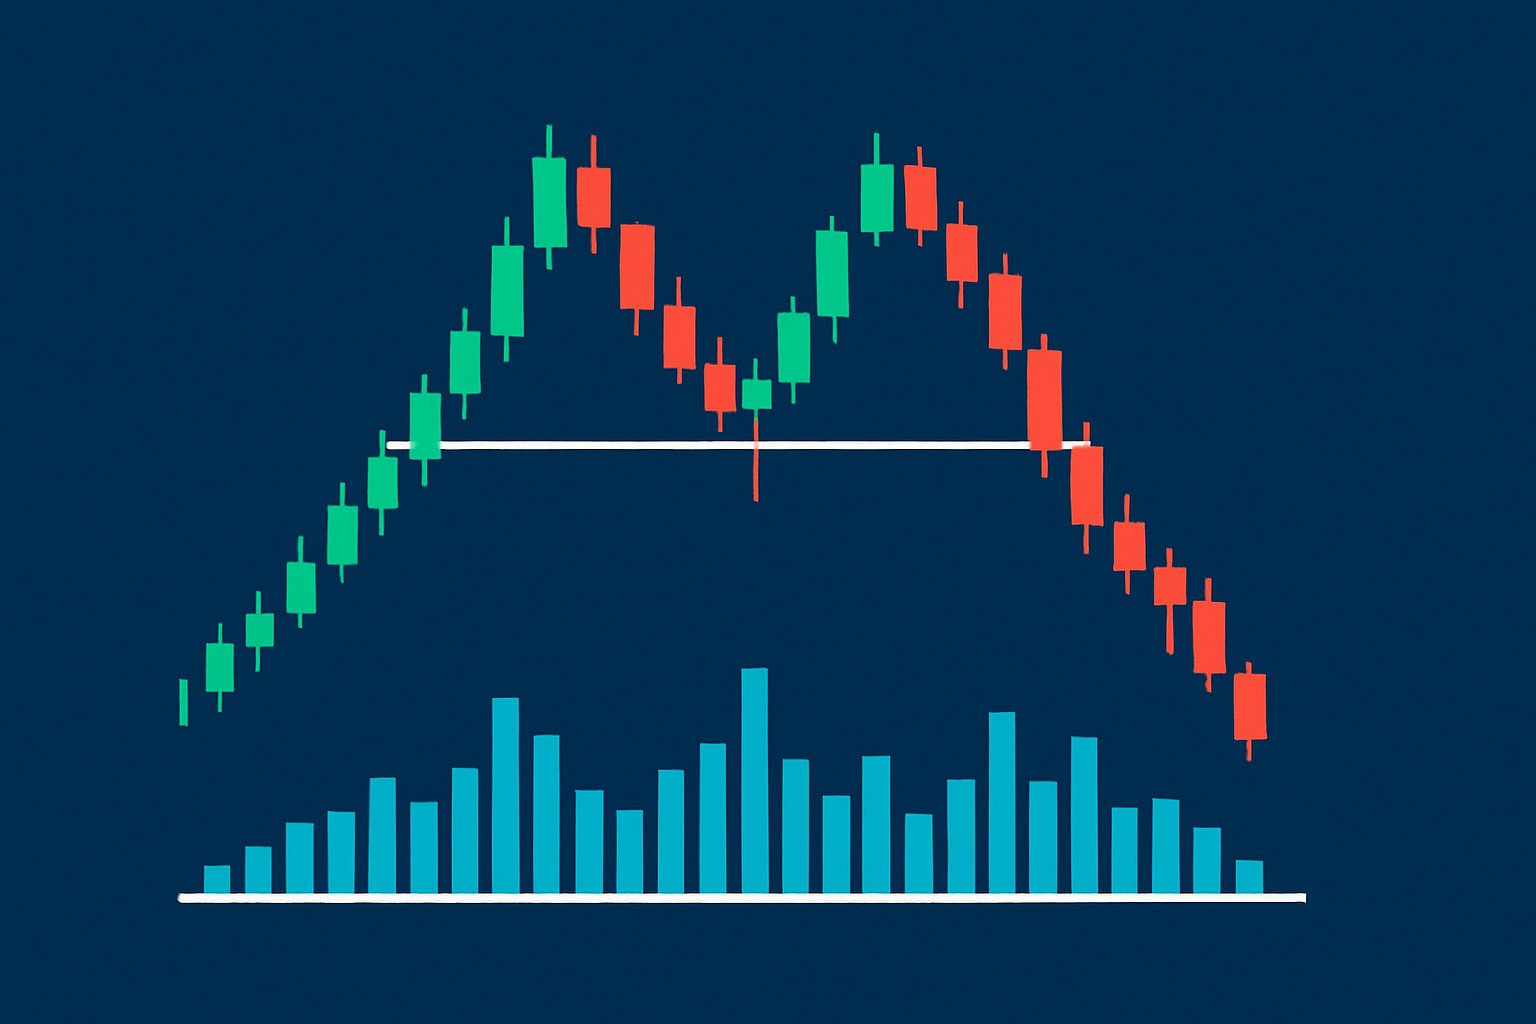
How to Confirm a Double Top Pattern with Volume Data
Master how to combine volume data with price action to confirm double top patterns, ensuring reliable signals and avoiding false breakouts in your technical analysis.
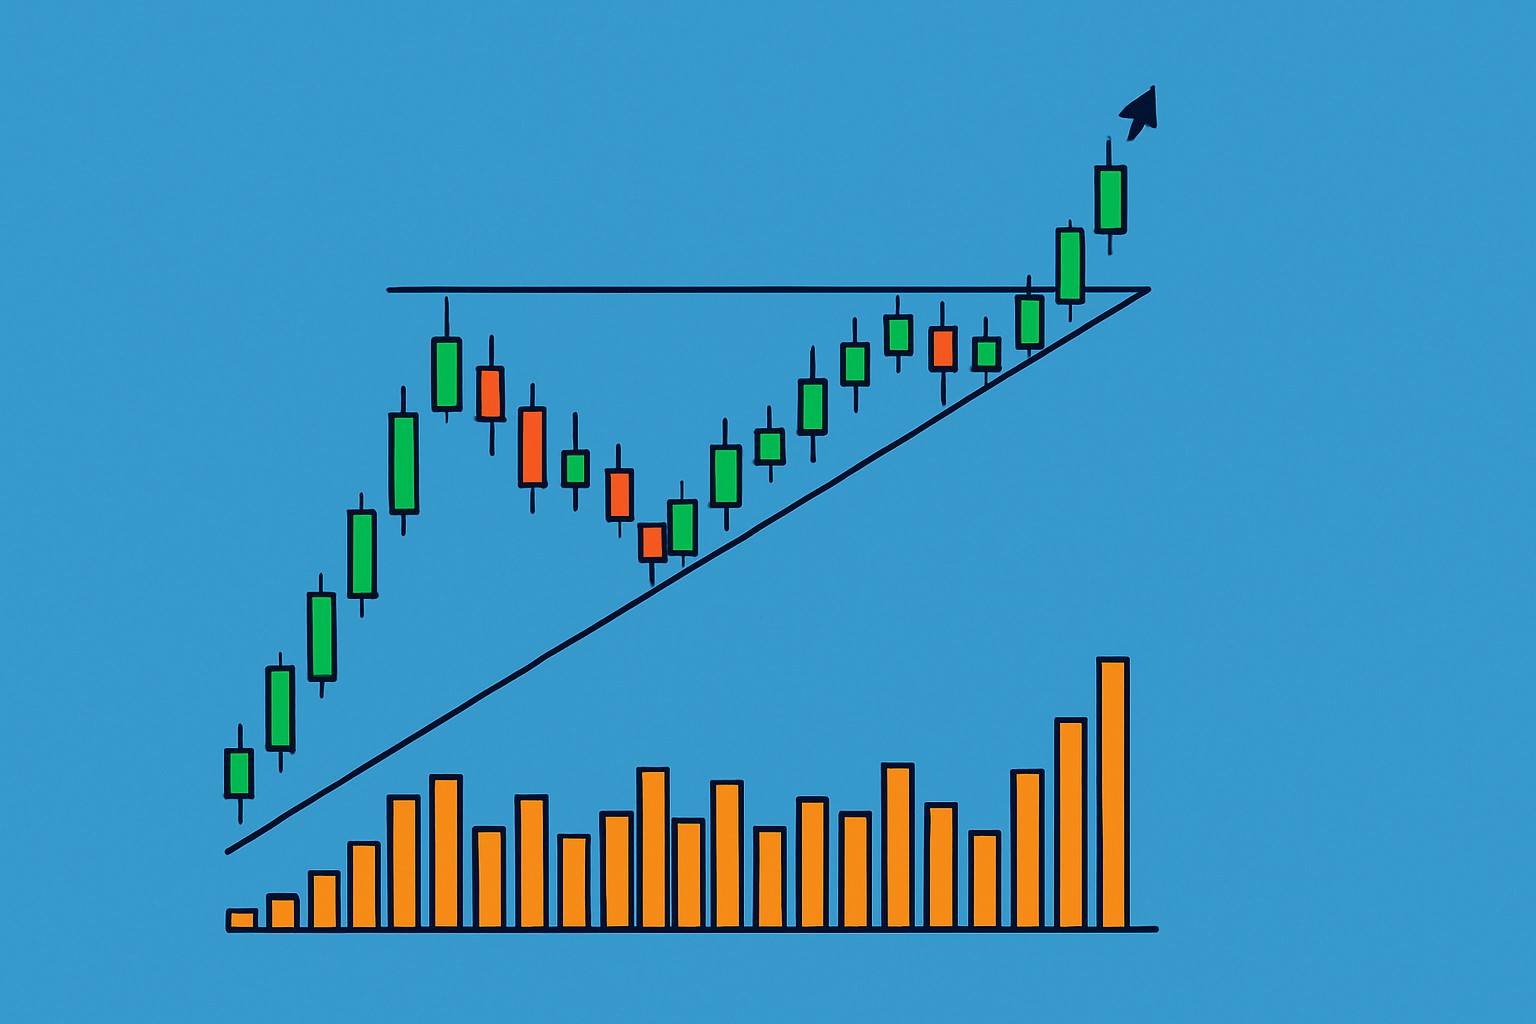
Recognizing the Ascending Triangle Pattern in Stocks
Discover how the ascending triangle pattern signals bullish momentum and learn to spot and trade it confidently with practical, beginner-friendly guidance.
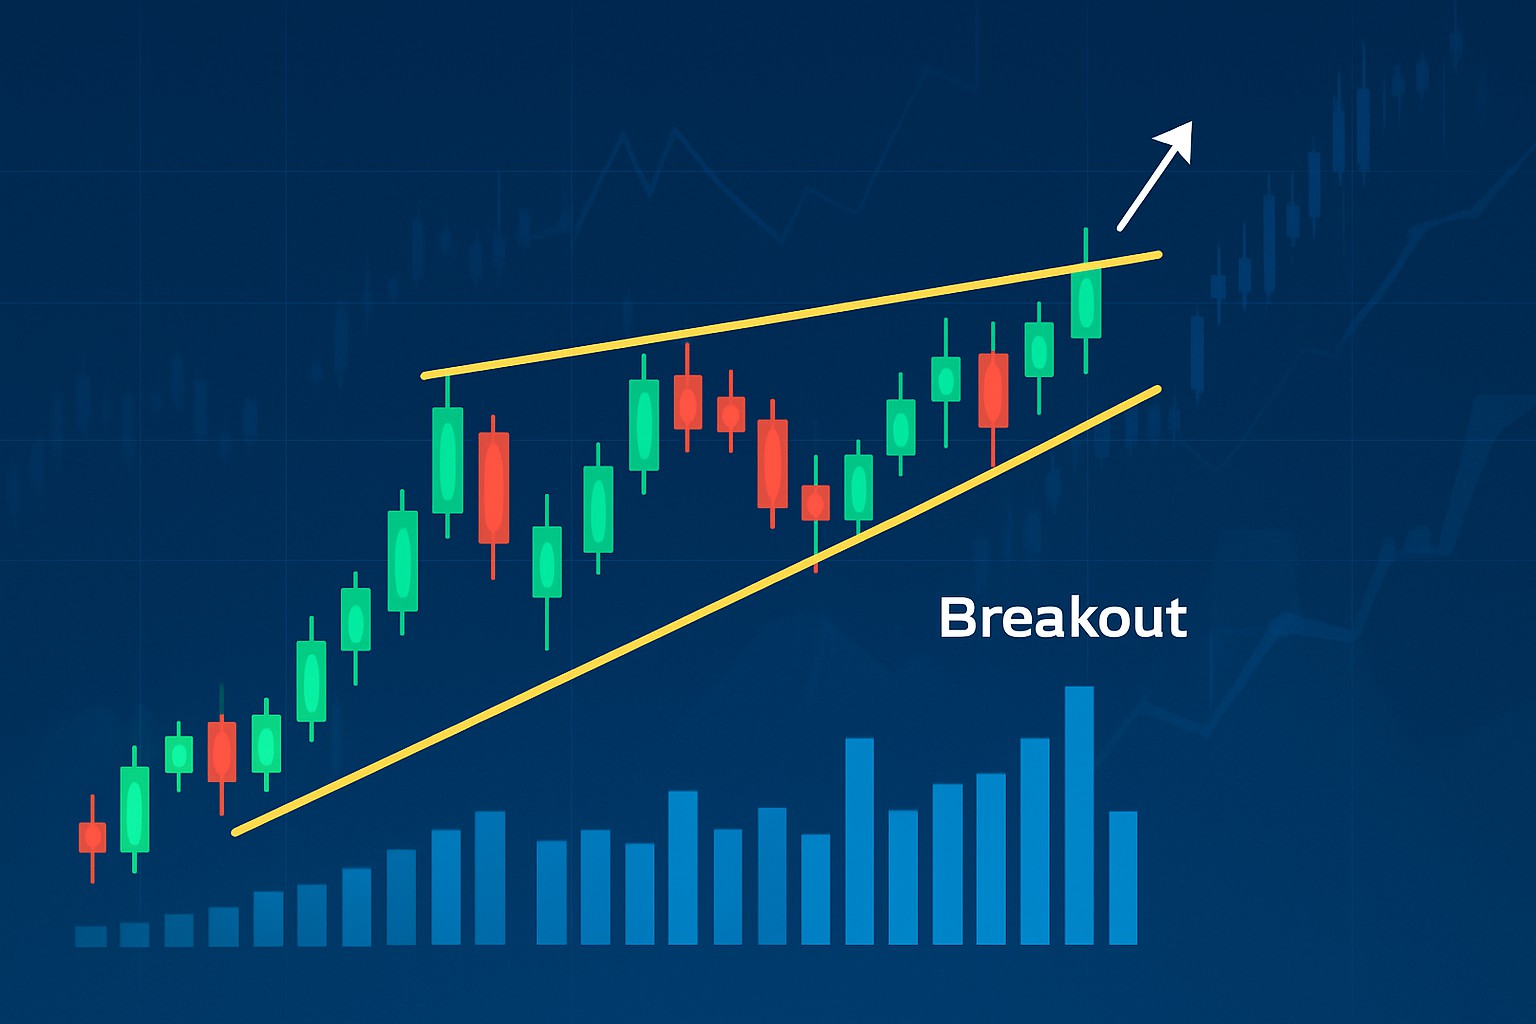
How to Trade an Ascending Triangle
Learn how to identify and trade ascending triangle patterns effectively. This guide breaks down the key steps, risk strategies, and tools to help you trade breakouts with confidence.

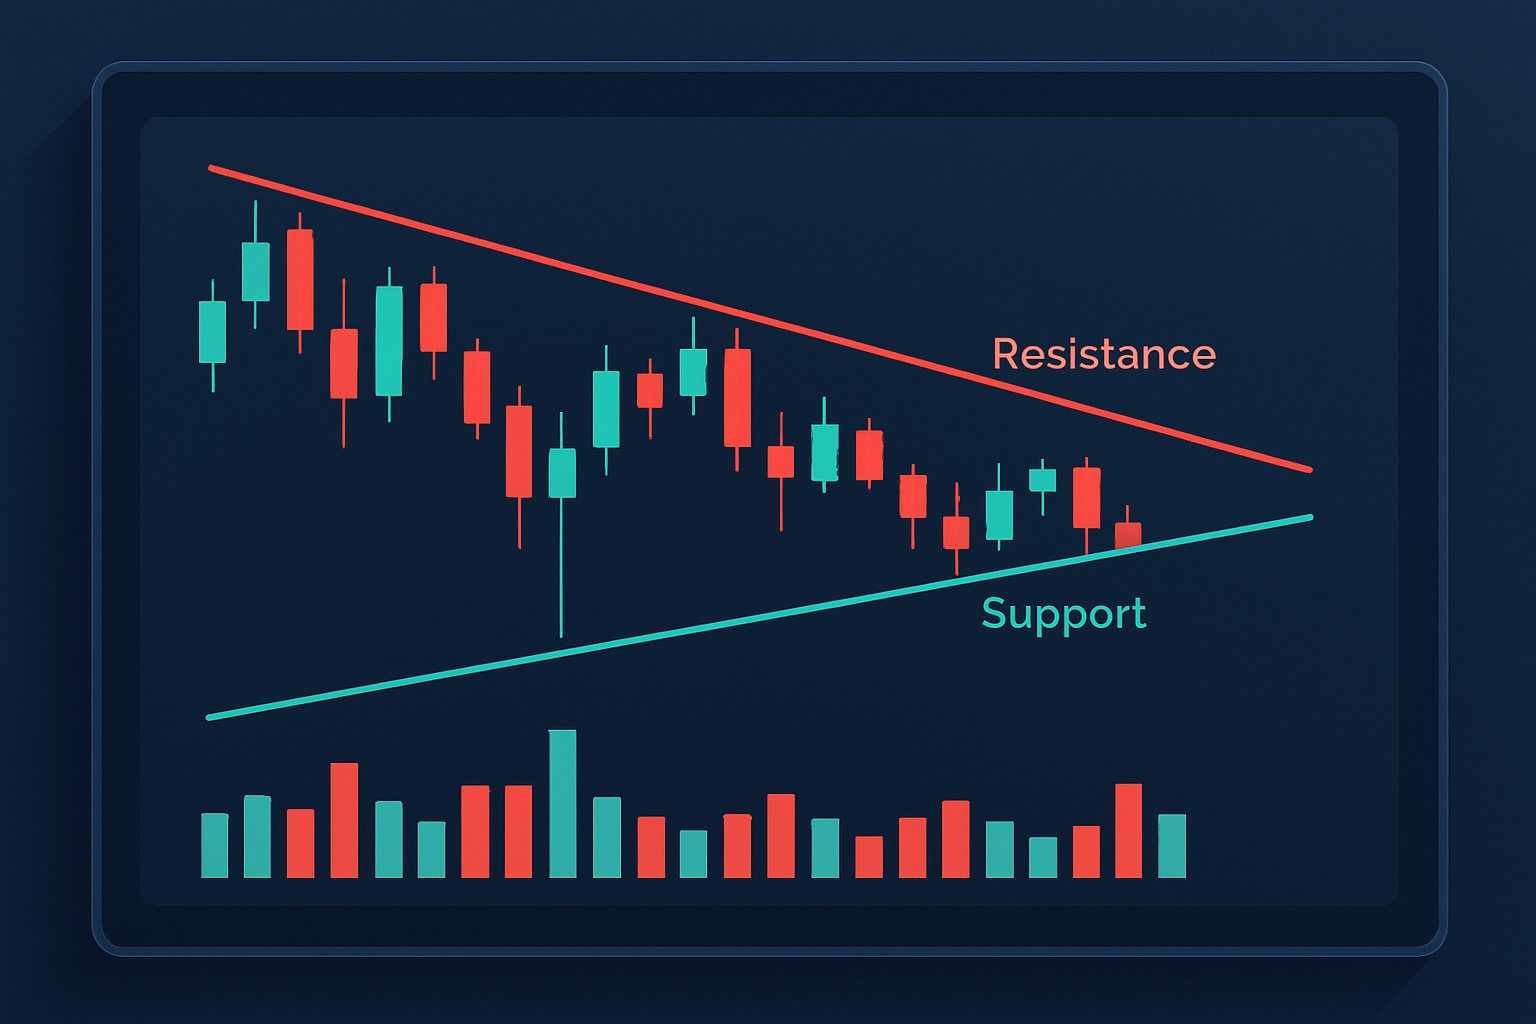
Using Descending Triangle Pattern
Unlock the power of the descending triangle pattern to anticipate market shifts. Learn to identify, analyze, and trade this key technical analysis formation confidently.

How to Spot an Engulfing Pattern for Better Trades
Master the art of spotting engulfing patterns with this practical guide and improve your trading accuracy and confidence with clear, actionable steps.
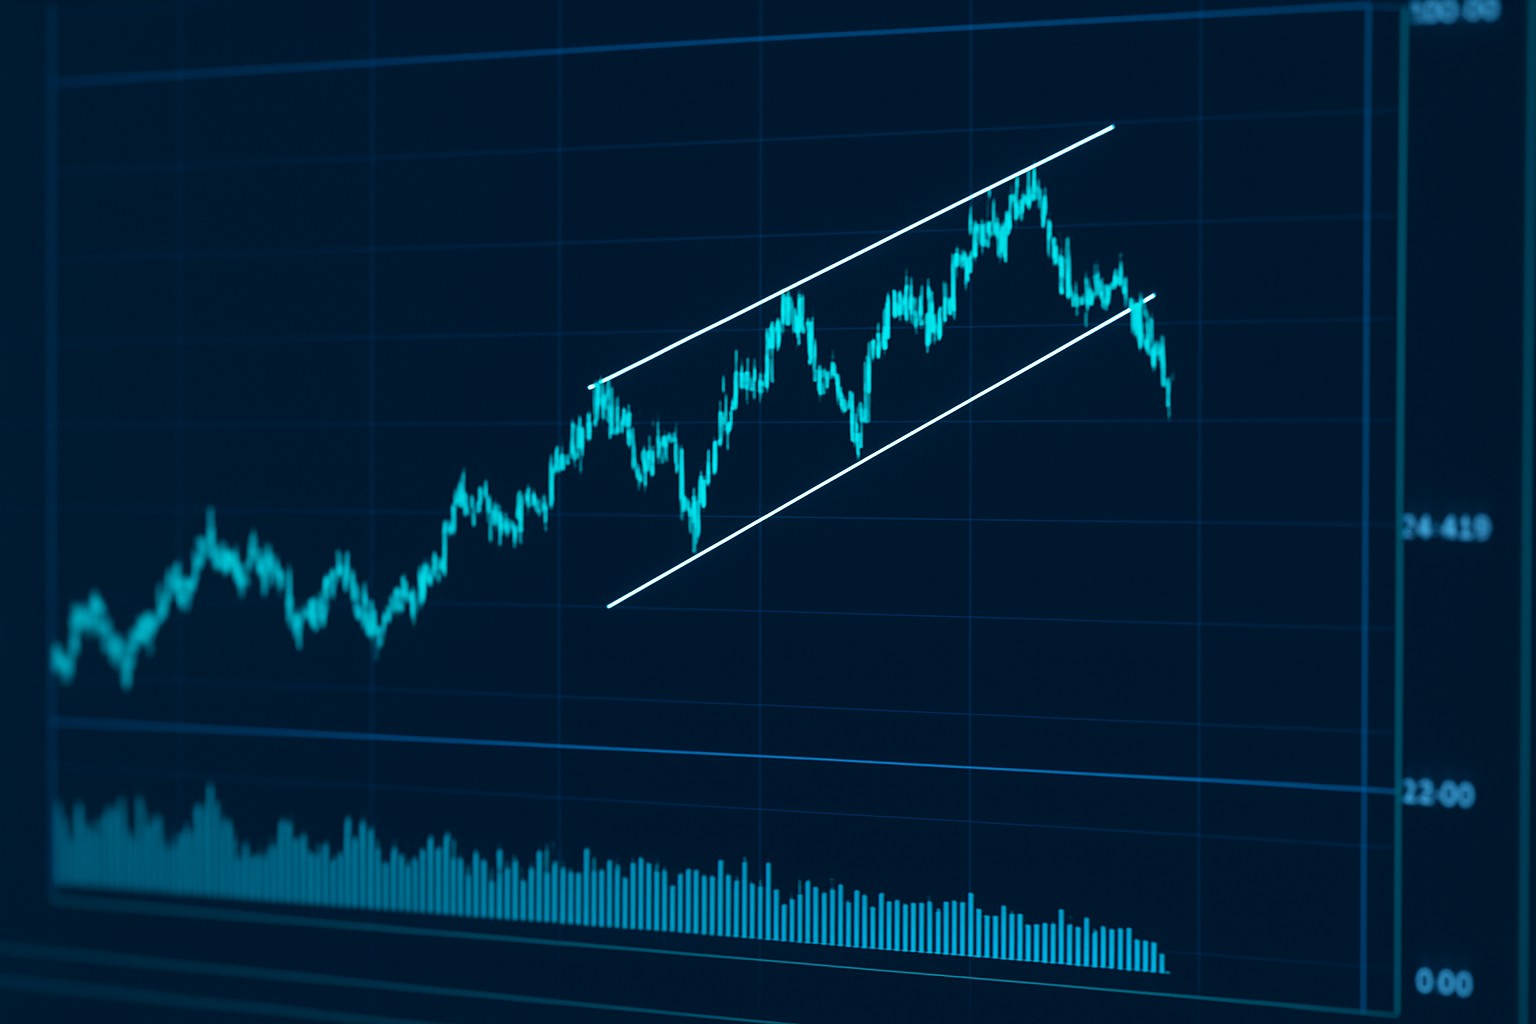
What a Rising Wedge Pattern Tells You About Market Moves
Discover how the rising wedge pattern reveals crucial insights about weakening market momentum and potential price reversals, empowering you to trade smarter.
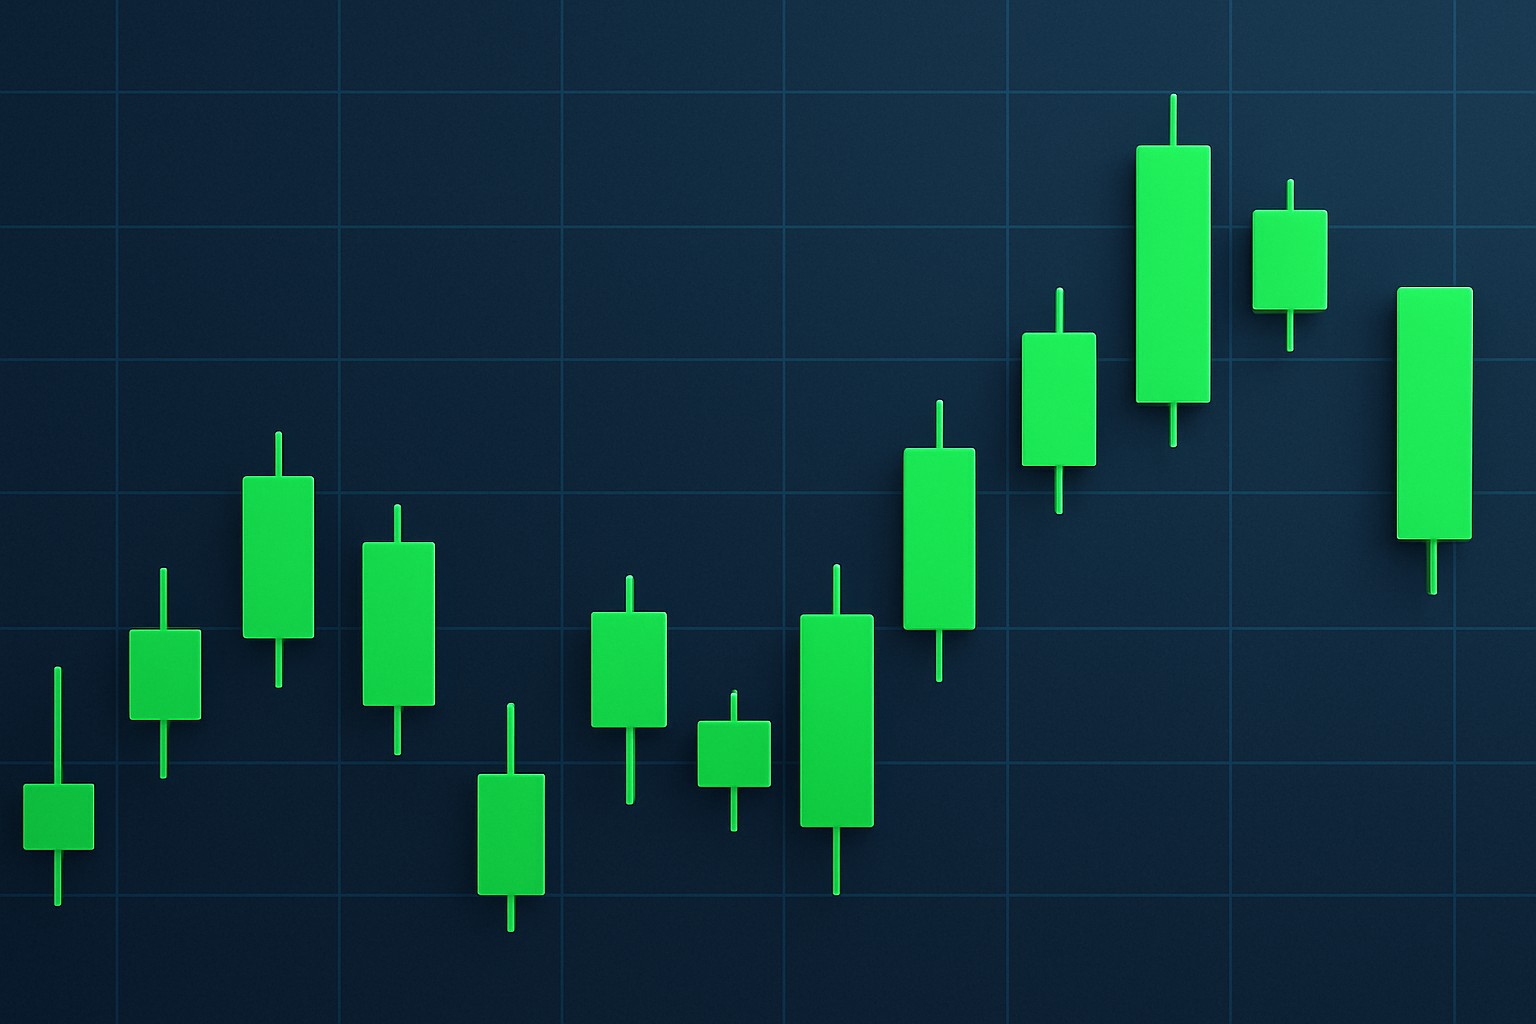
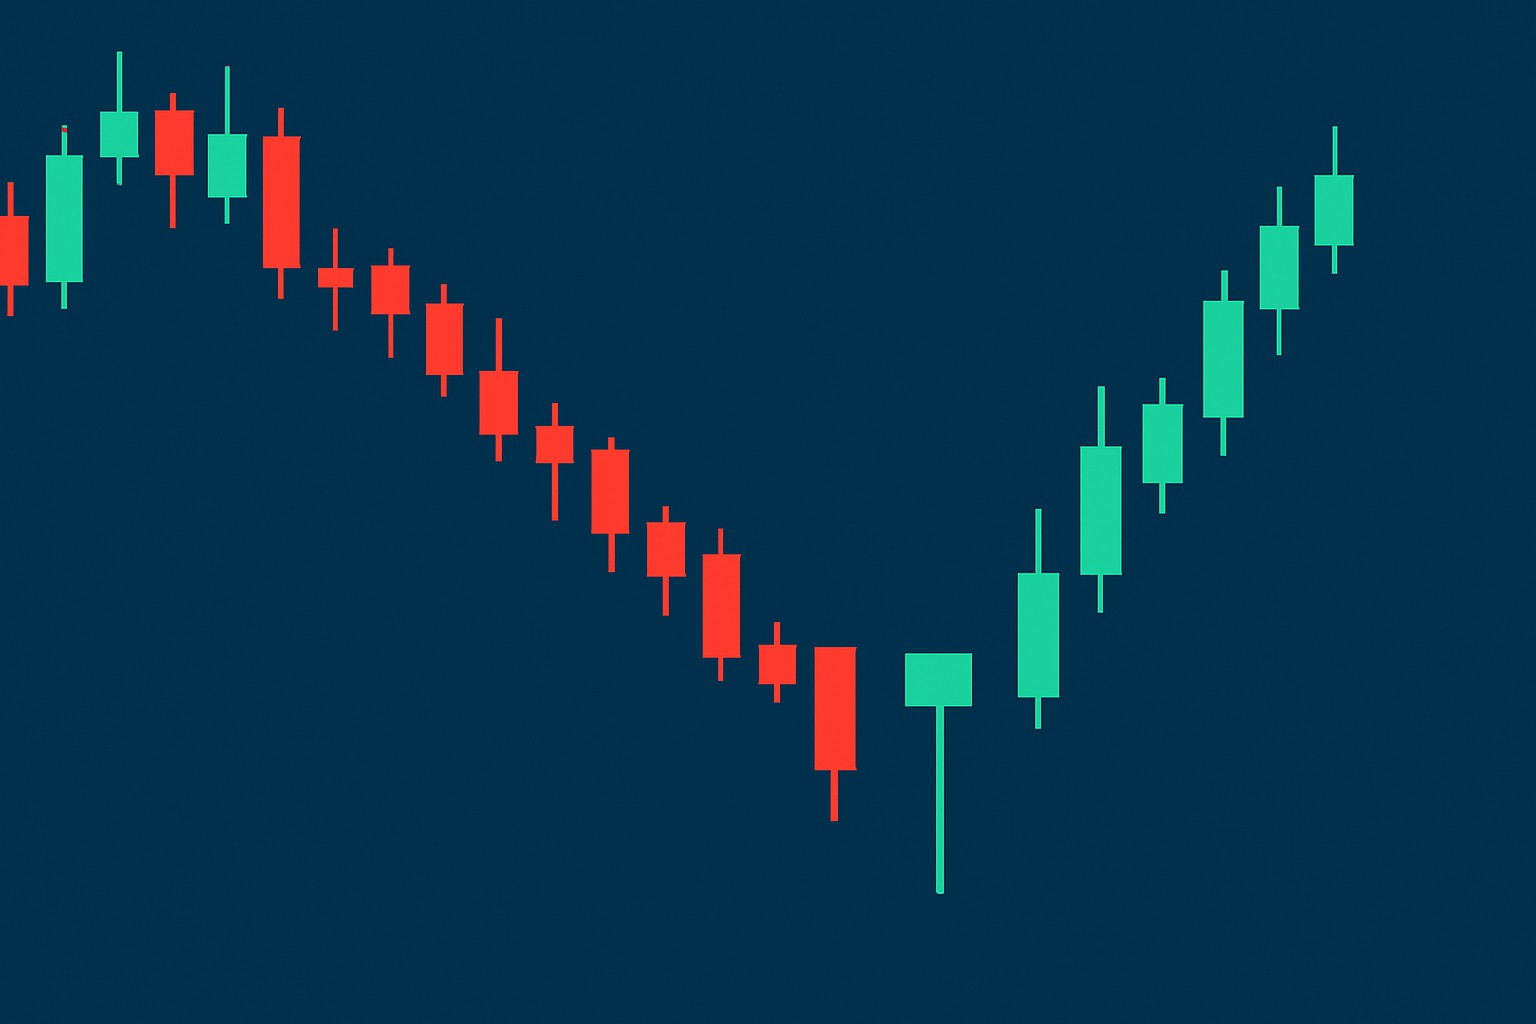
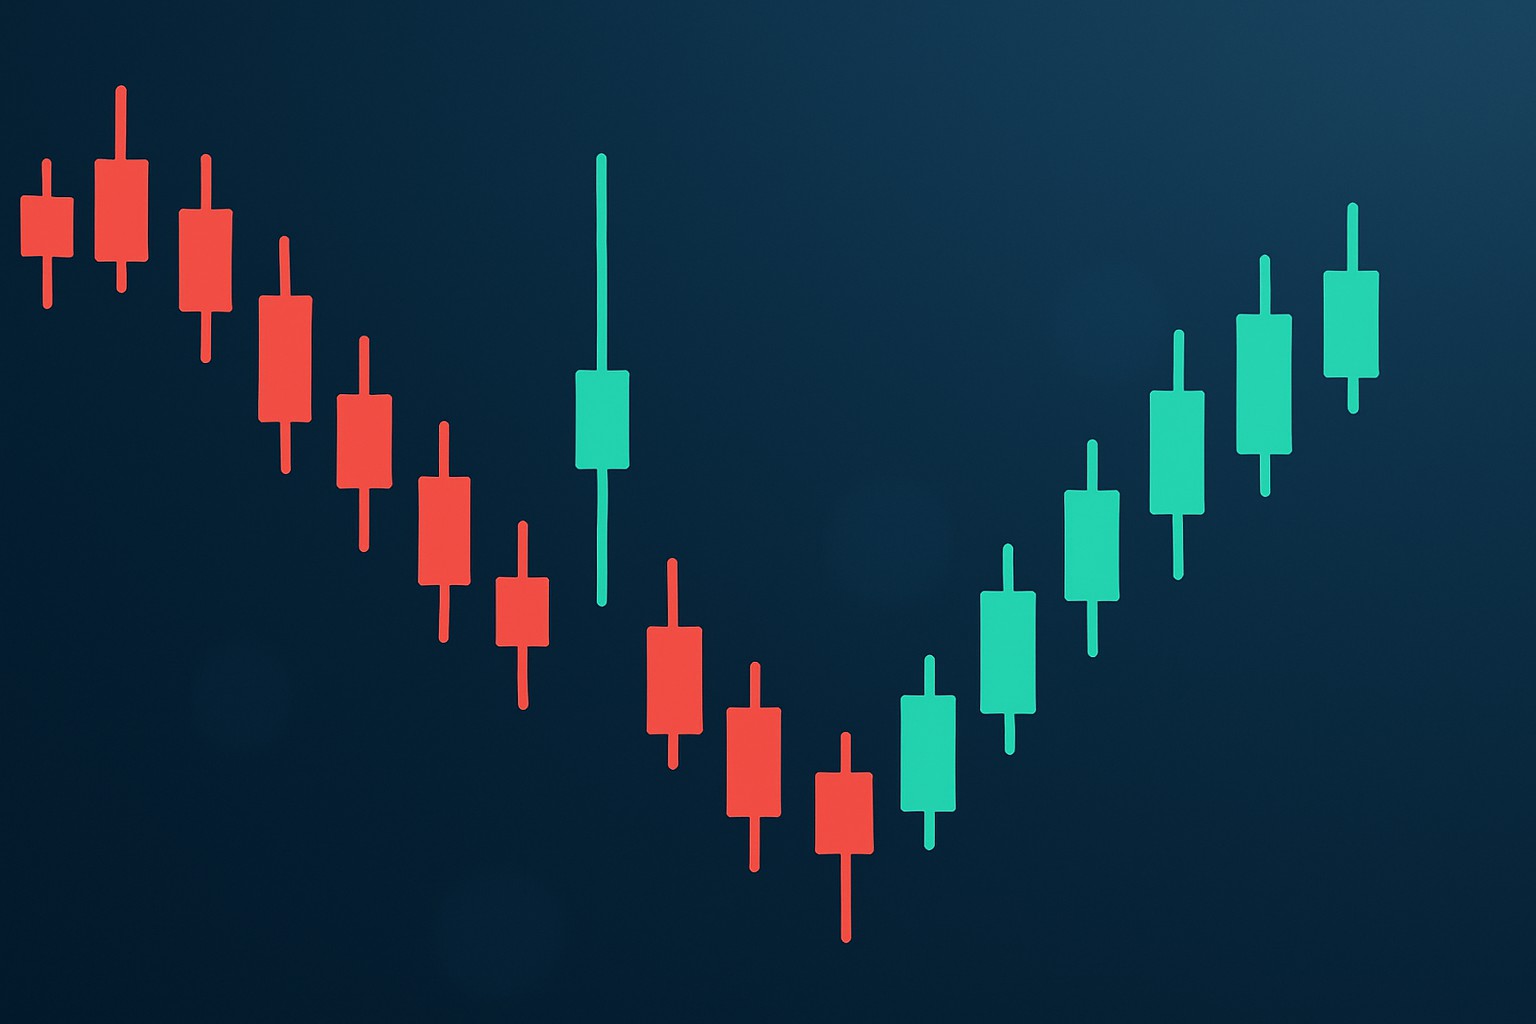
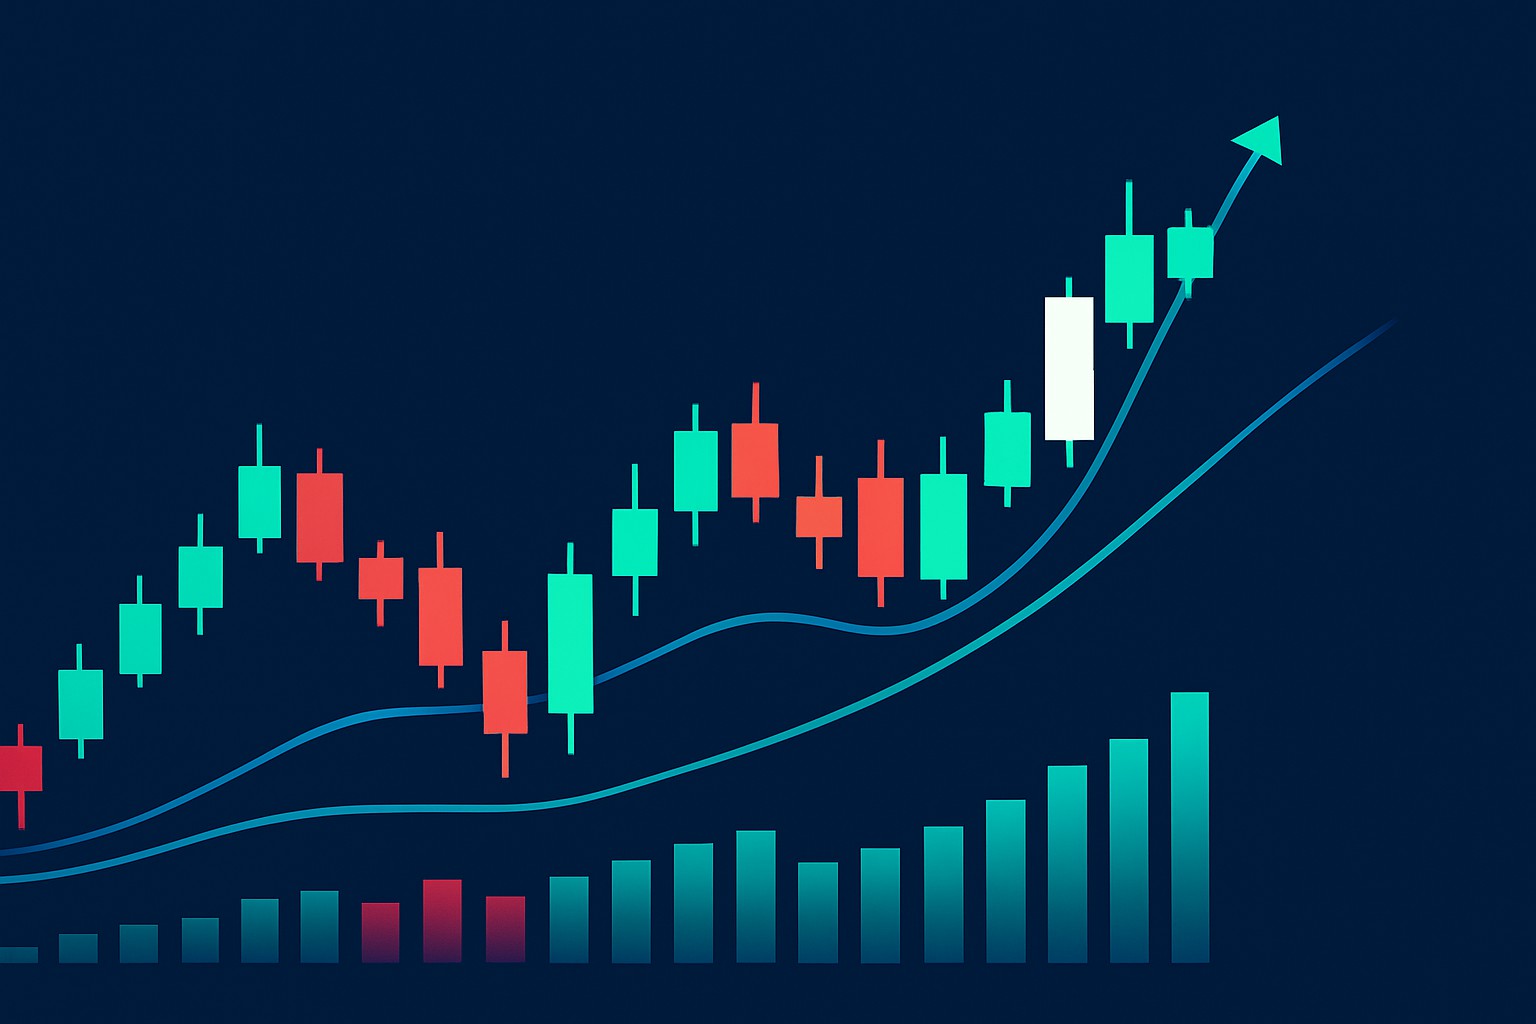
Identify Bullish Candlestick Patterns in Any Market
Master bullish candlestick patterns to spot potential market uptrends in stocks, forex, and cryptocurrency. This guide offers clear, step-by-step strategies for all experience levels.
