
Technical Analysis
90 articles
Utilize chart patterns, indicators, and price action to identify trends and entry/exit points.
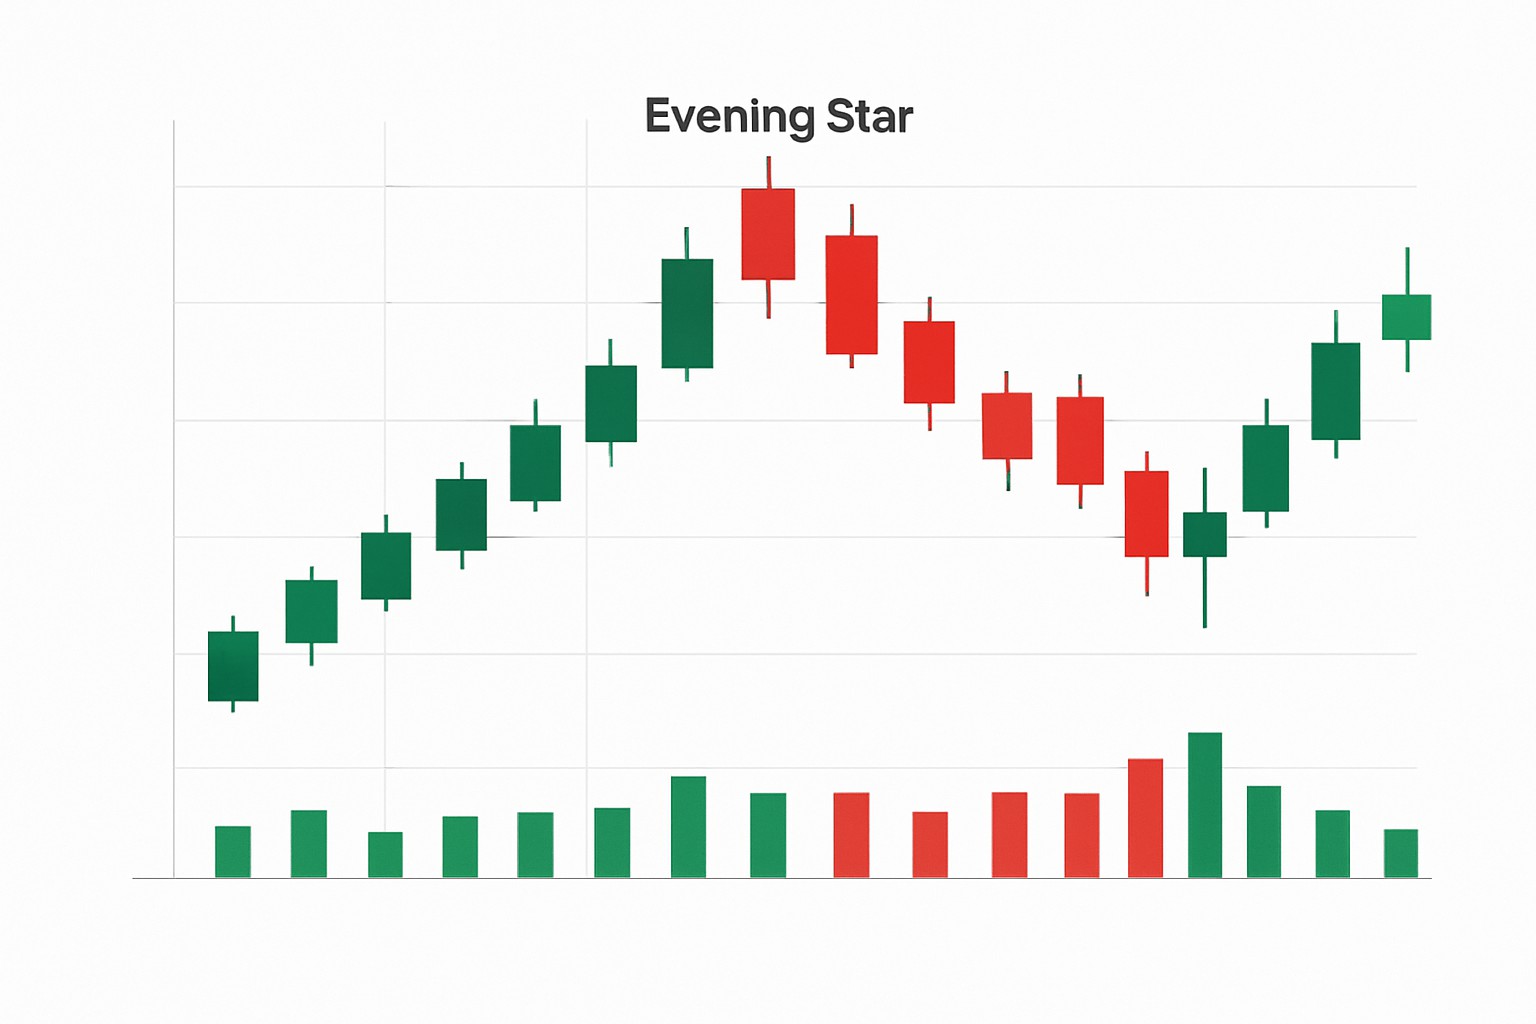
How to Spot the Evening Star Pattern in Trading Charts
Master the evening star pattern to catch important market reversals. This guide helps traders spot it easily and trade with confidence.

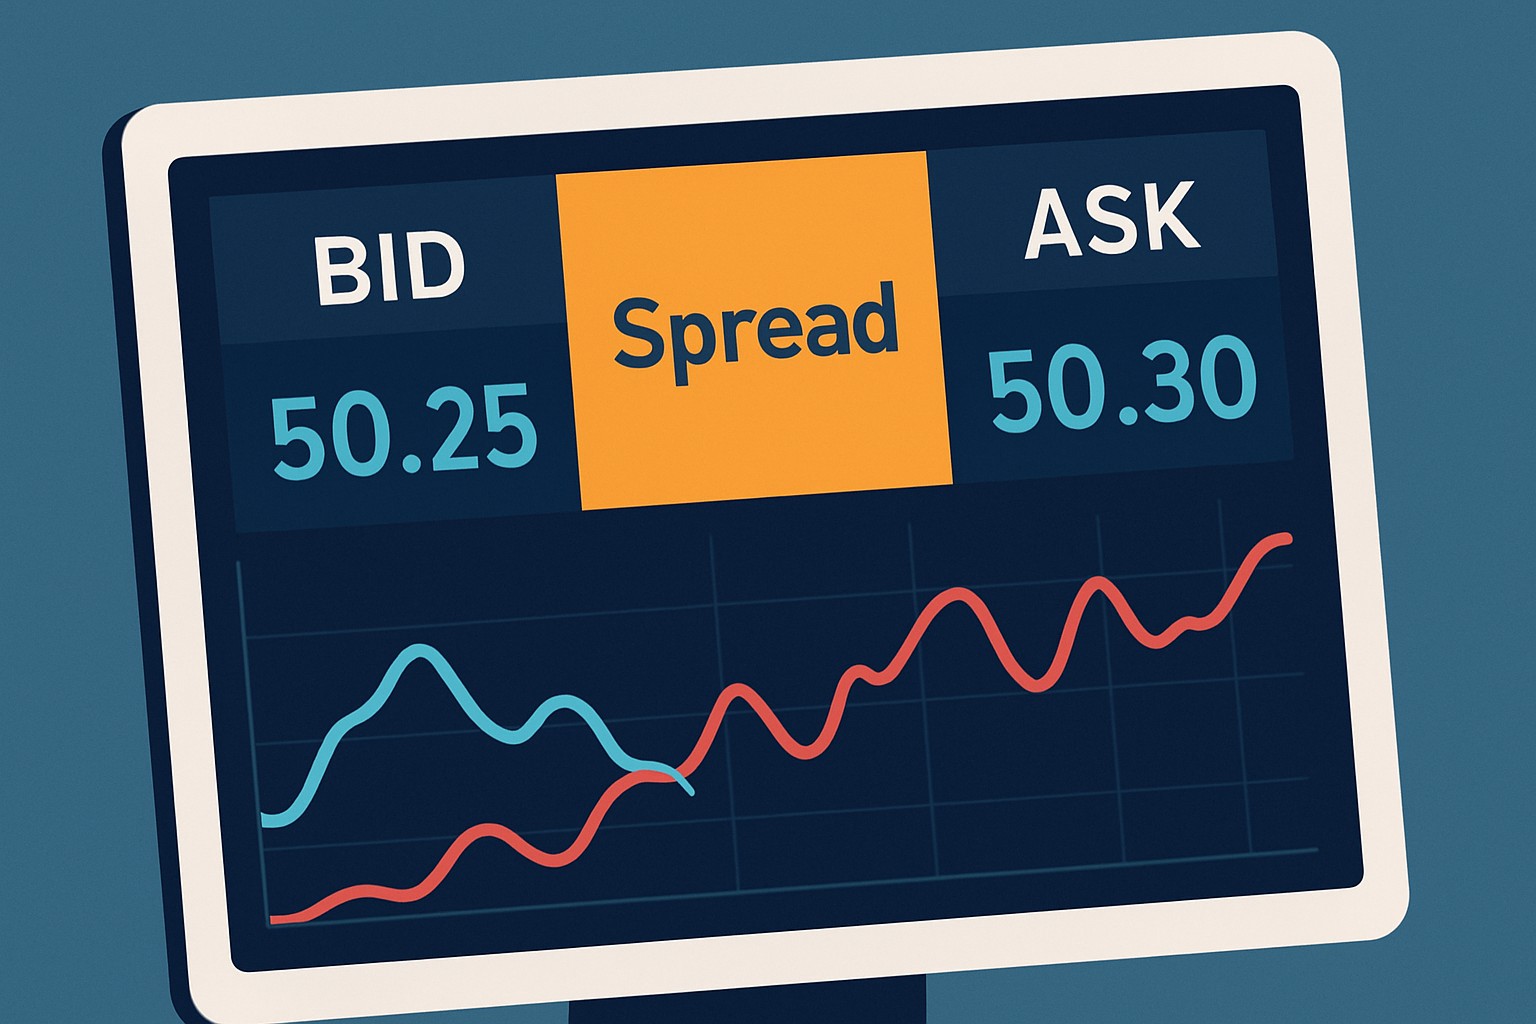
Understanding the Bid Rate vs Ask Rate in Trading
The bid-ask spread is a crucial part of trading that influences costs, liquidity, and price discovery. Understand bid rate vs ask rate to make smarter trading decisions.

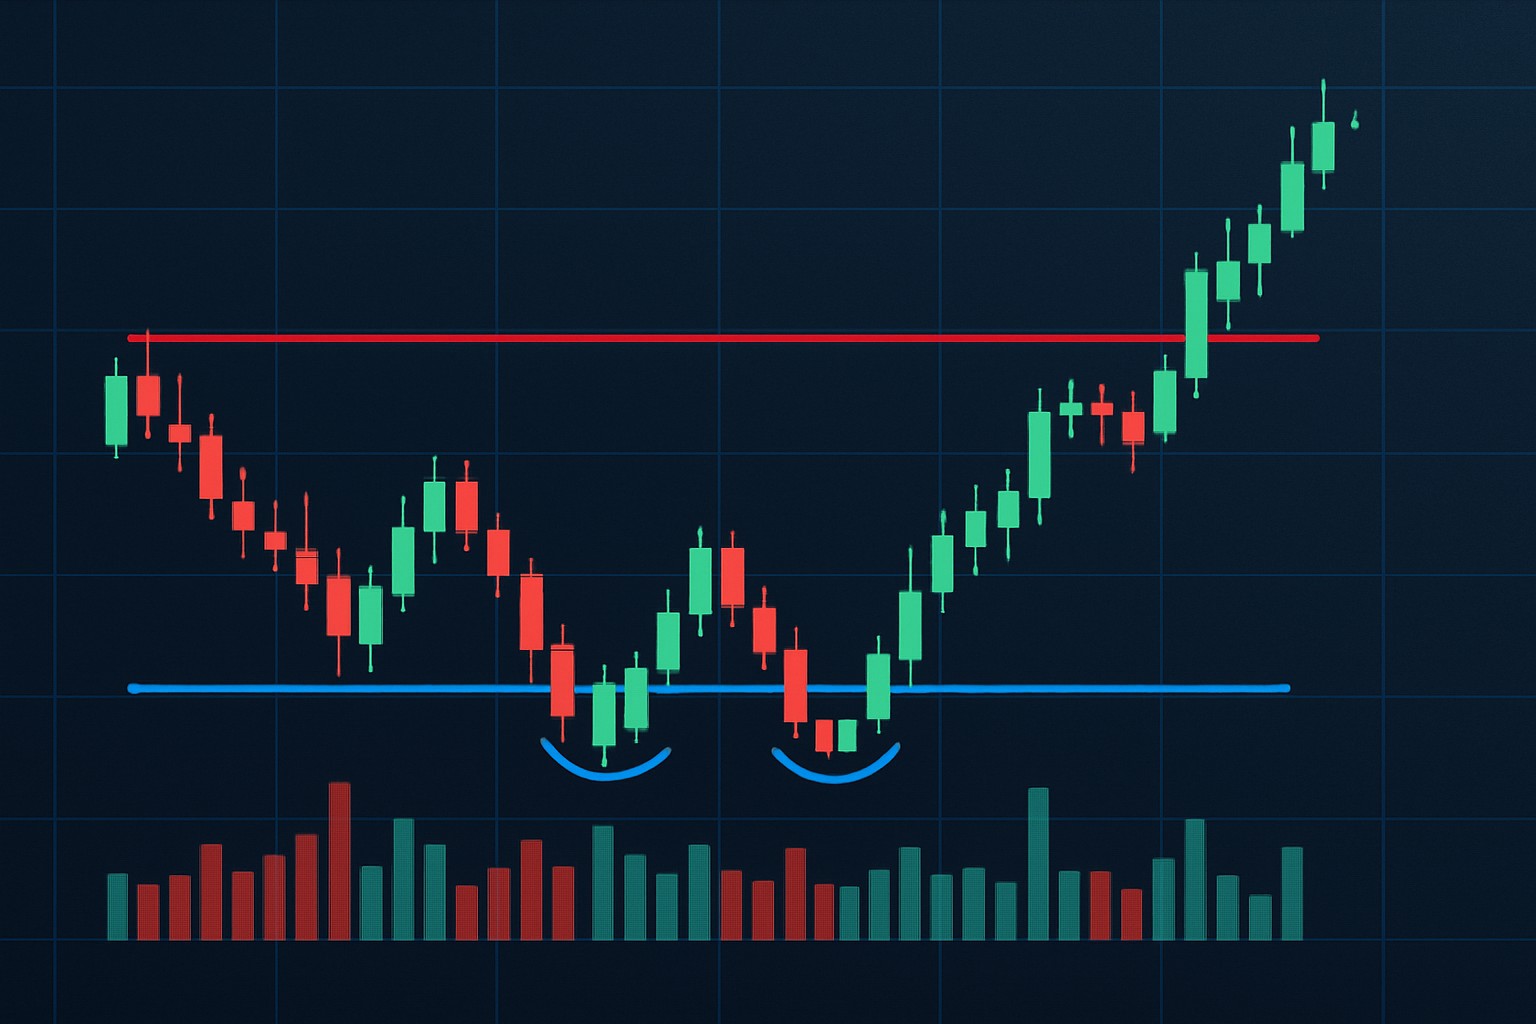
When Triple Bottom Patterns Signal a Bullish Bounce
Learn to spot triple bottom patterns — key technical signals that often mark the end of downtrends and the start of bullish bounces in asset prices.

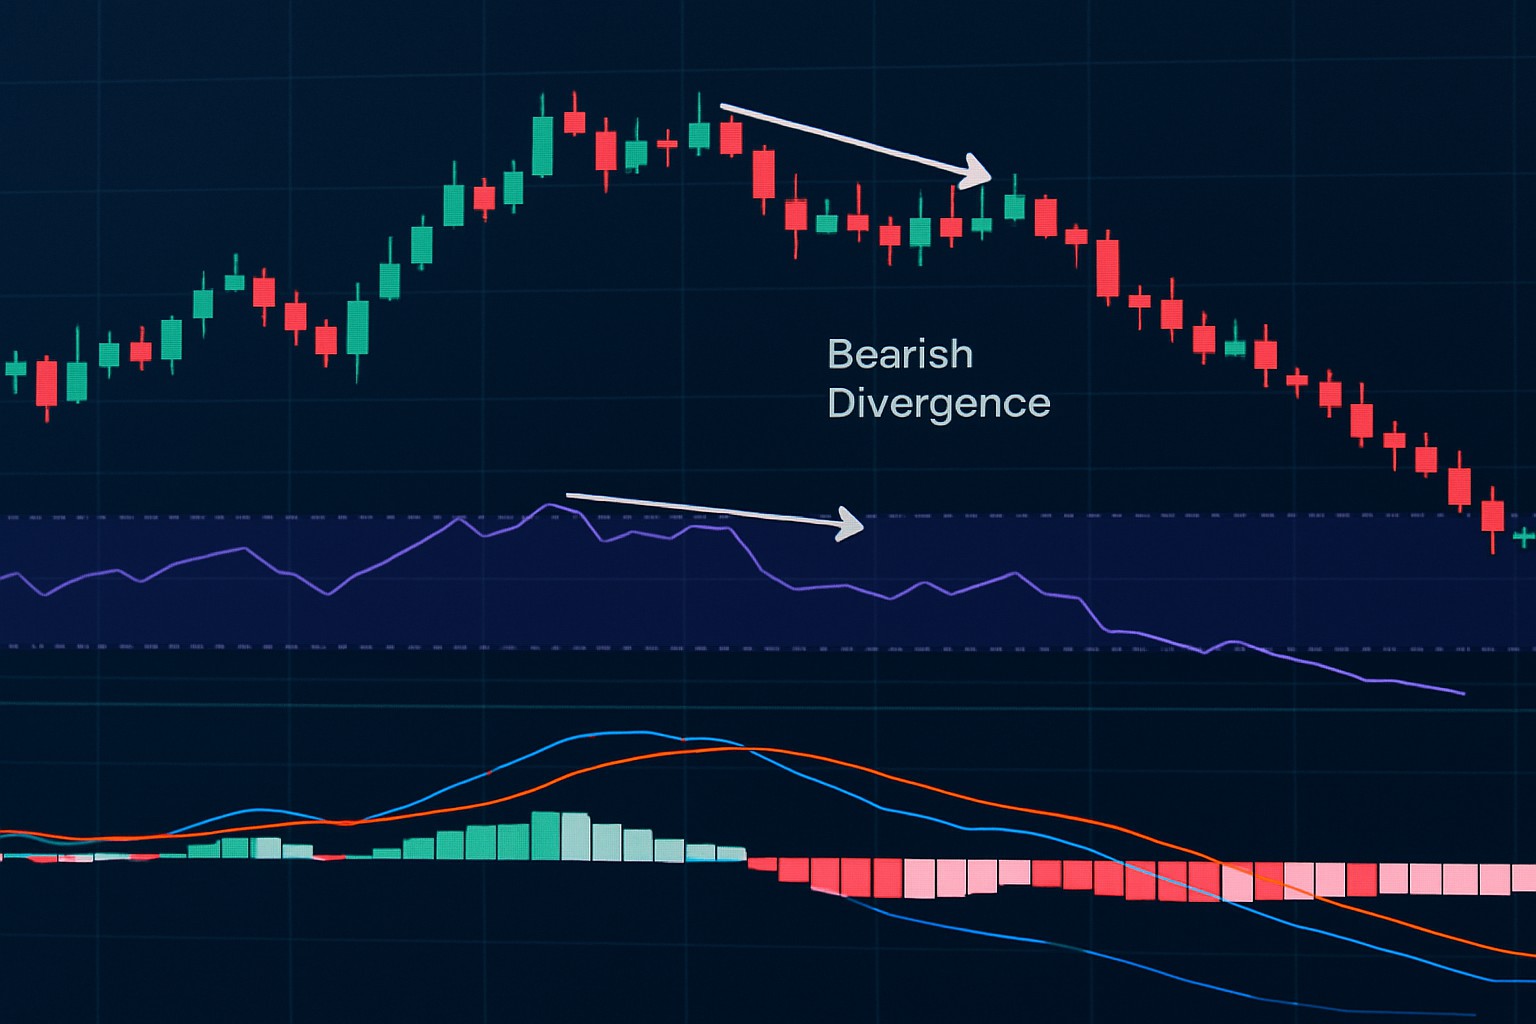
Bearish Divergence Explained - How to Identify Early Reversal Signals
Bearish divergence is a powerful technical analysis tool that signals weakening upward momentum before price reversals. Discover how to recognize, verify, and trade bearish divergence effectively.

How to read the stochastic index for clearer trade signals?
Discover how to decode the stochastic index to identify clearer trade signals, improve market timing, and enhance your trading strategy with practical, easy-to-understand guidance.

Types of Candlesticks and Their Meanings
Unlock the secrets behind candlestick chart patterns with this detailed guide. Learn how different types of candlesticks reveal market sentiment and guide trading strategies.
Heikin Ashi candles to spot trend reversals
Learn how to use Heikin Ashi candles to detect trend reversals more confidently. This guide provides actionable tips and advanced techniques to enhance your trading strategy.
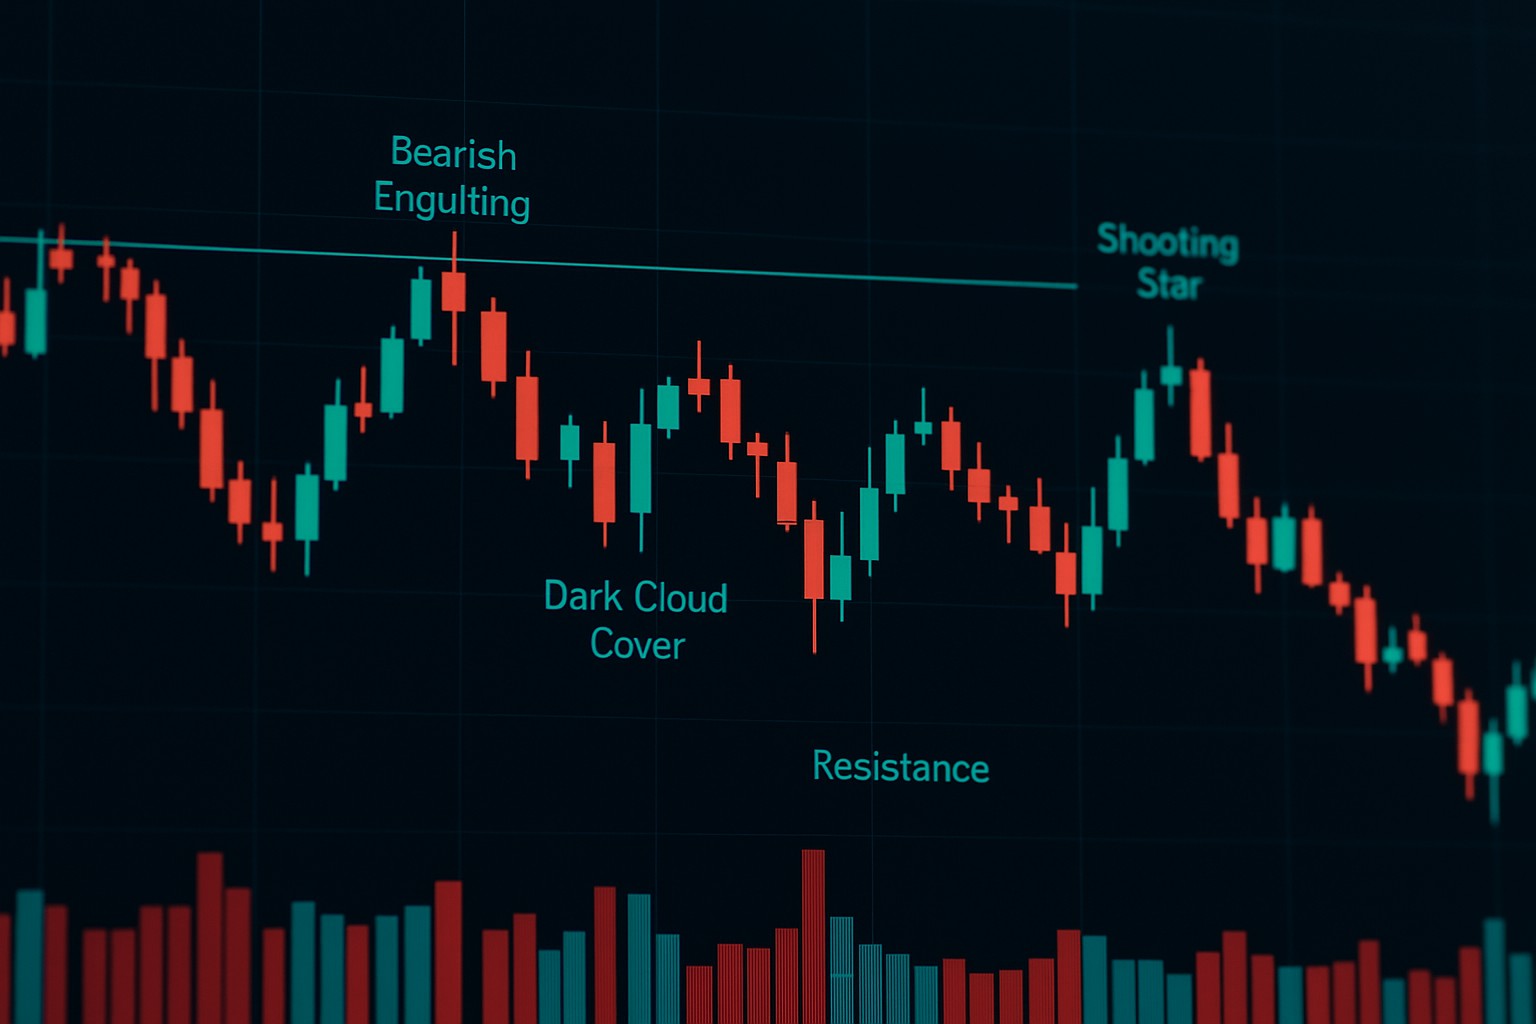
Spotting bearish candlestick patterns that could predict dips
Master the art of spotting bearish candlestick patterns to predict market dips with expert insights. Gain actionable strategies that boost your technical analysis skills and trading success.
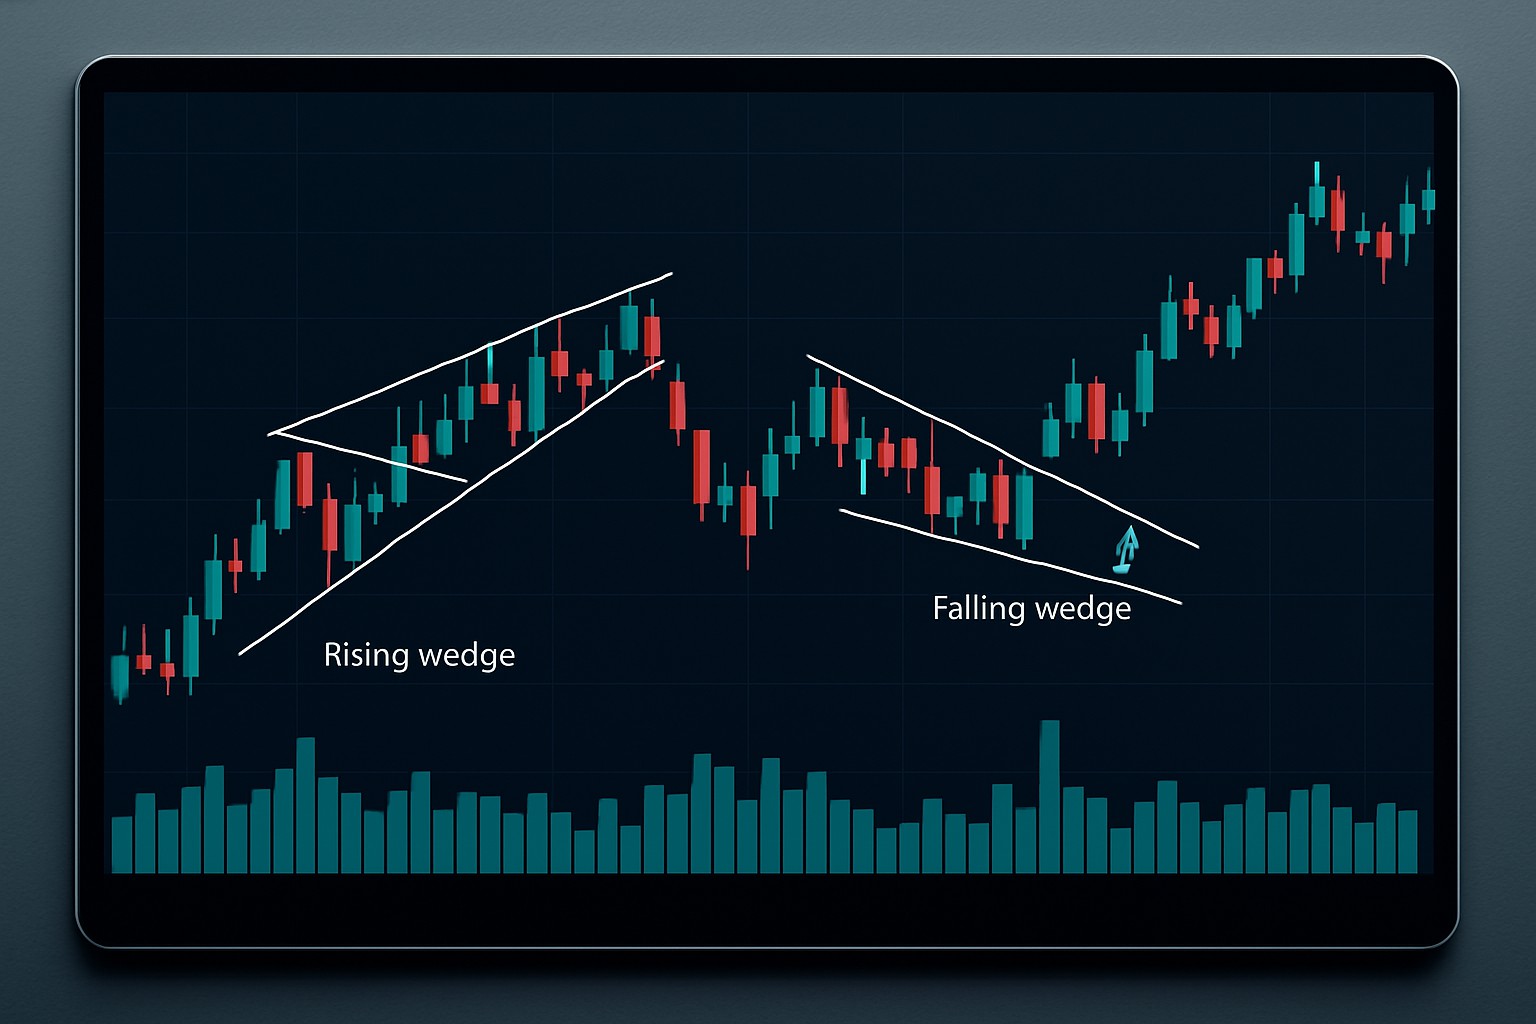
How to Spot (and Trade) Rising and Falling Wedge Patterns
Learn to identify rising and falling wedge patterns with ease, understand their market signals, and apply effective trading strategies to enhance your technical analysis skills.

Using Three White Soldiers to Find Buying Opportunities
Discover how the three white soldiers candlestick pattern identifies strong bullish momentum and smart buying opportunities, helping traders enter markets confidently.

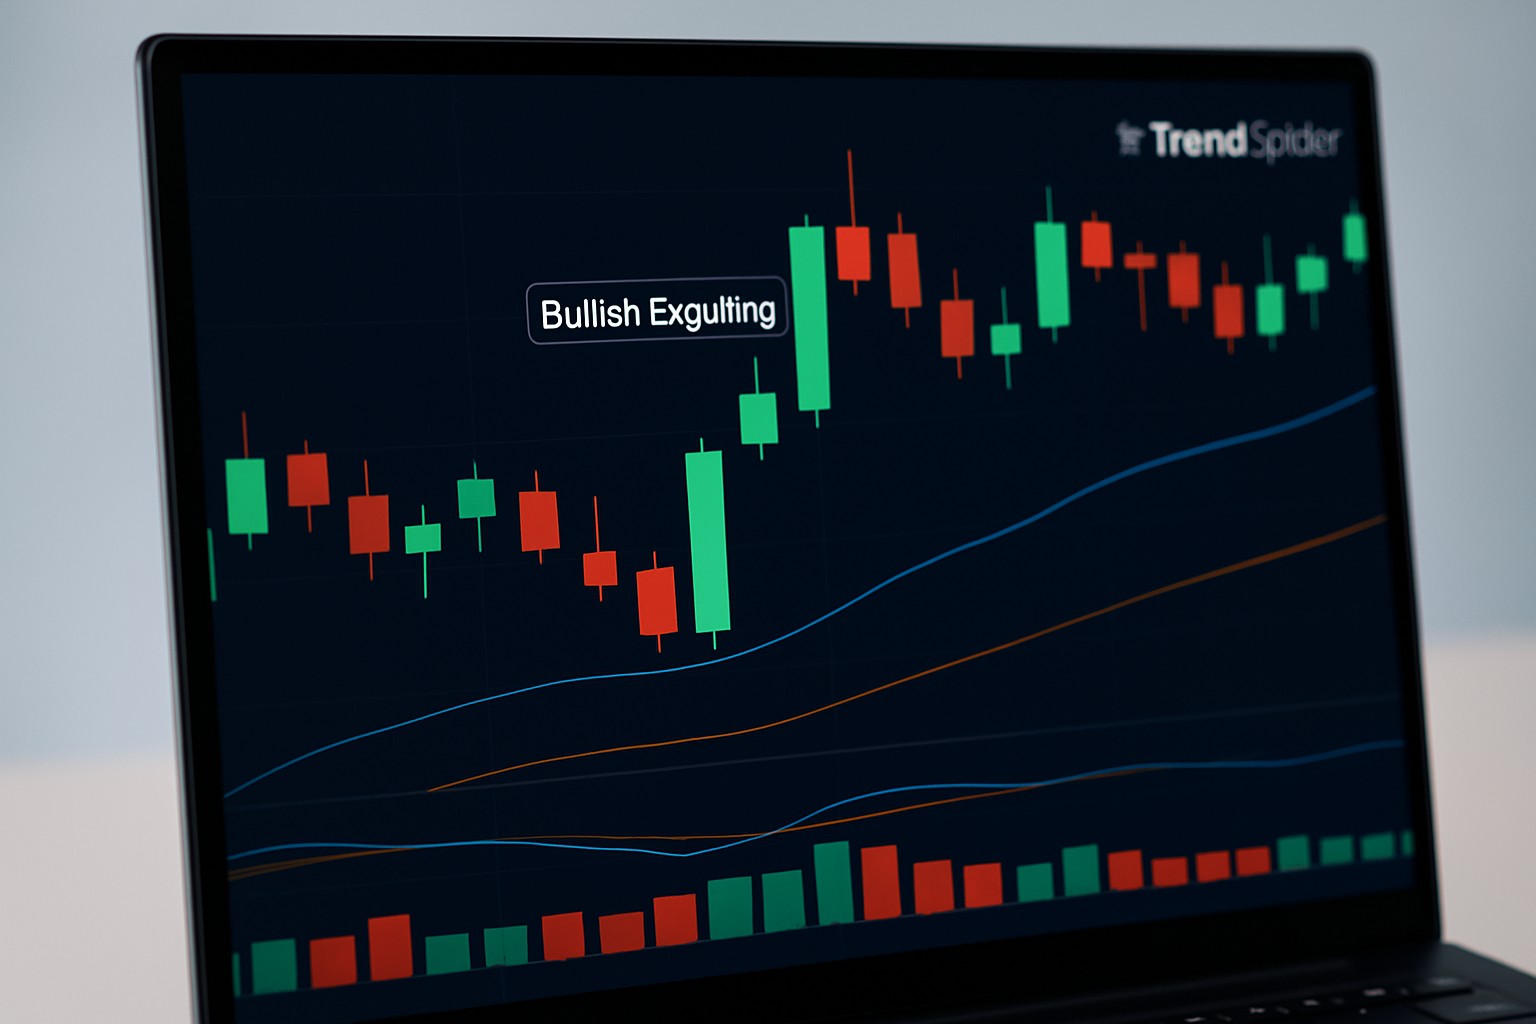
Using Bullish Engulfing to Spot Reversals in TrendSpider
Discover how the bullish engulfing candlestick pattern signals key trend reversals. Learn to identify and trade it effectively using TrendSpider’s powerful automated tools.


Understanding the SOPR Metric for Bitcoin and Crypto Investing
Discover how SOPR reveals when Bitcoin and crypto holders take profits or losses, providing valuable insights into market trends and investor sentiment.
