
Technical Analysis
90 articles
Utilize chart patterns, indicators, and price action to identify trends and entry/exit points.
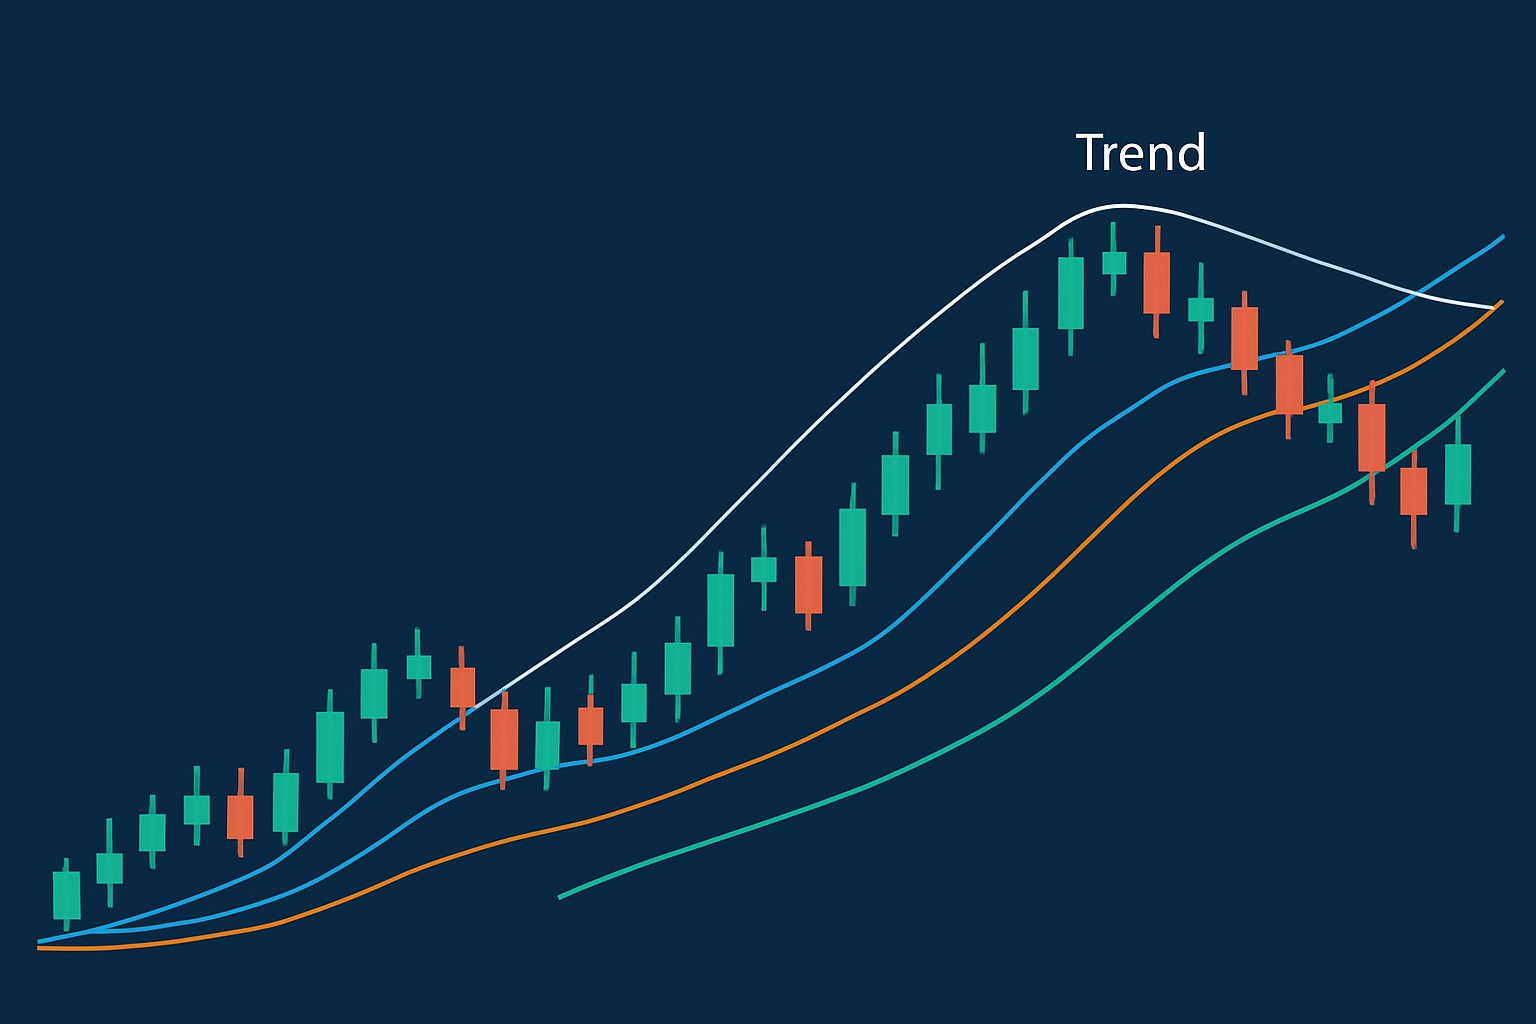
Spot Trends Using Simple Moving Average Lines
Discover how simple moving average lines can help you identify clear market trends and make smarter trading decisions with this practical step-by-step guide.


Chart Patterns Cheat Sheet for Quick Trades
Unlock faster, smarter trading with our definitive chart patterns cheat sheet. Learn essential patterns, avoid common mistakes, and apply proven strategies for quick trade execution.

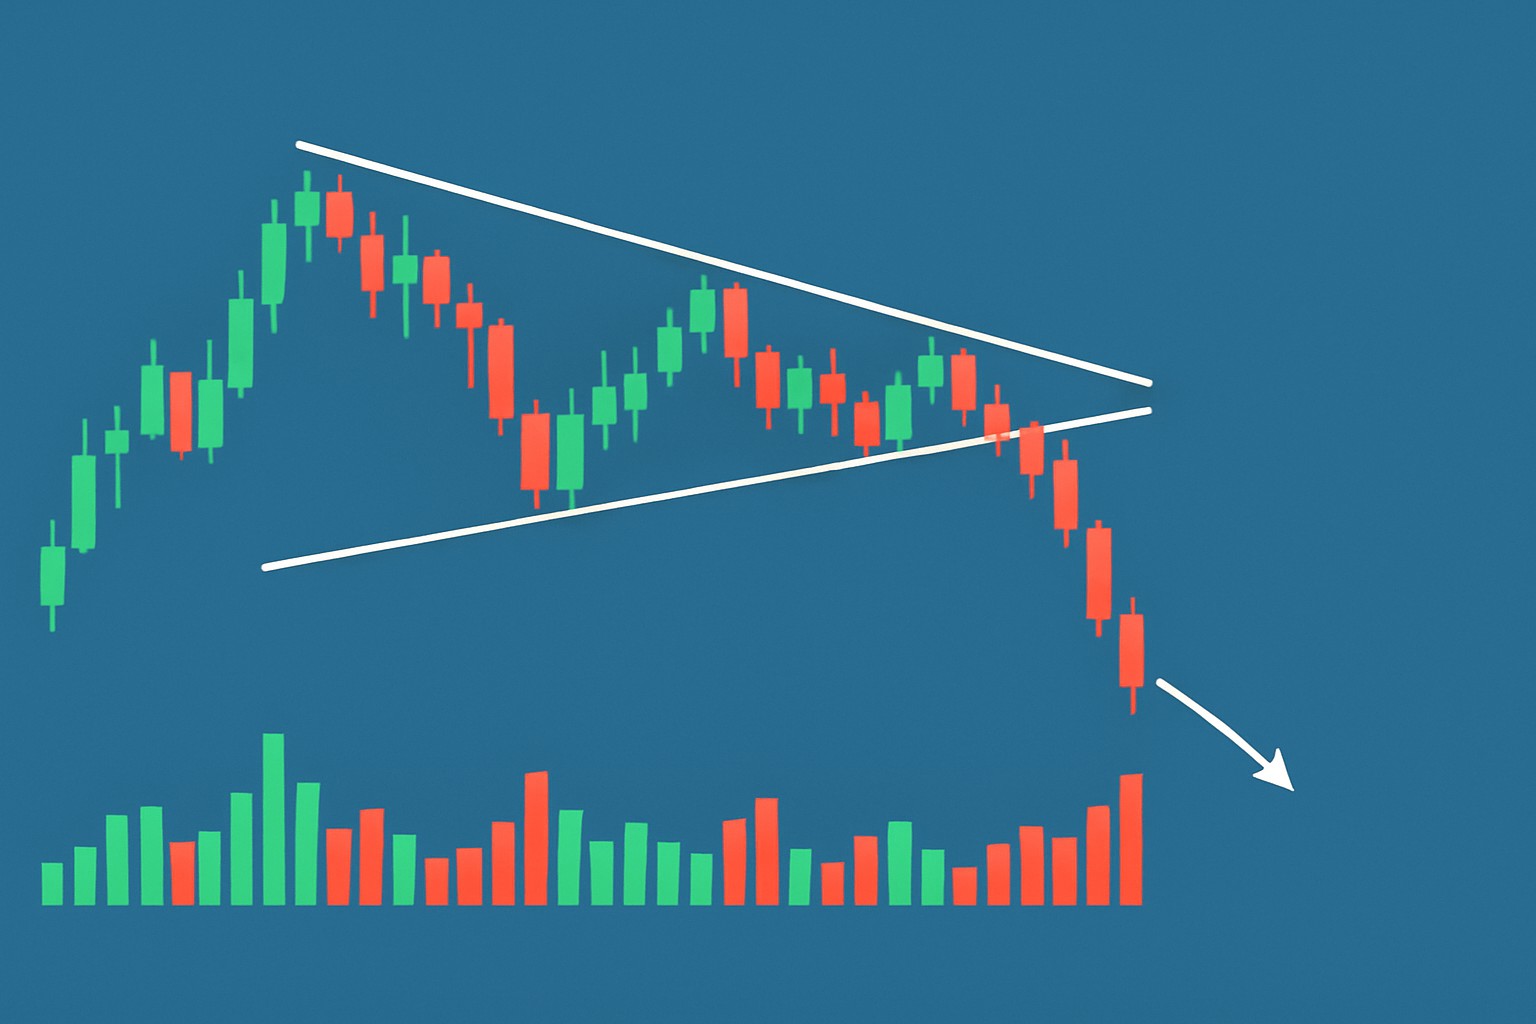
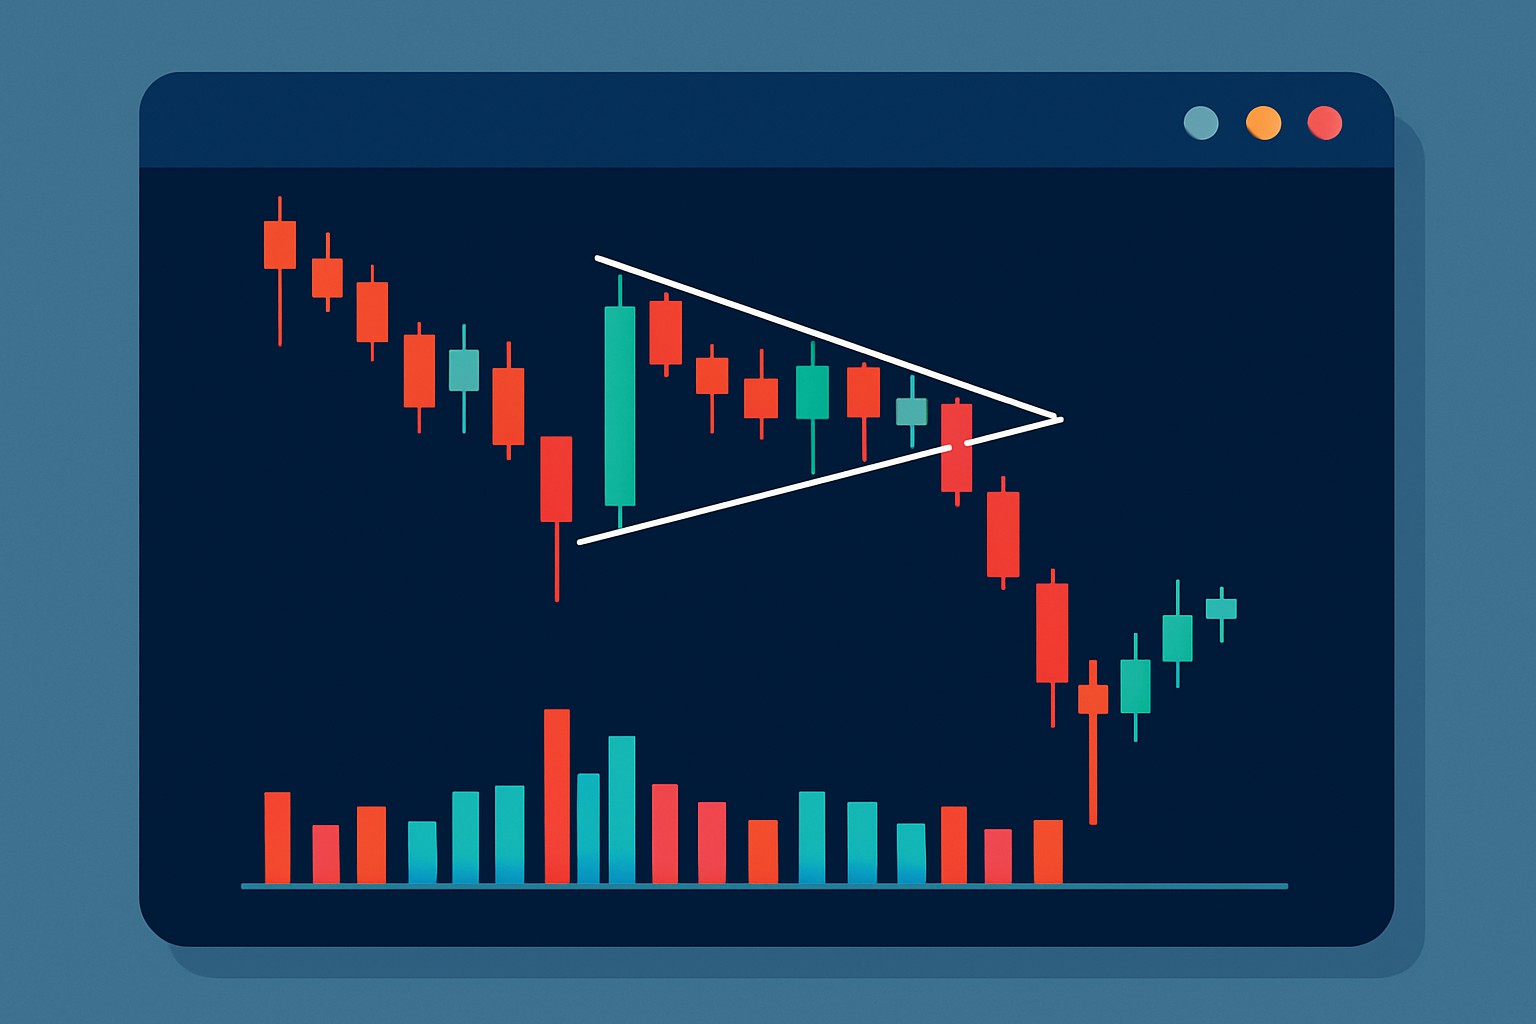
Making Sense of the Descending Triangle Chart Formation
Master the descending triangle chart pattern with easy-to-understand explanations and actionable trading strategies to navigate bearish market signals confidently.

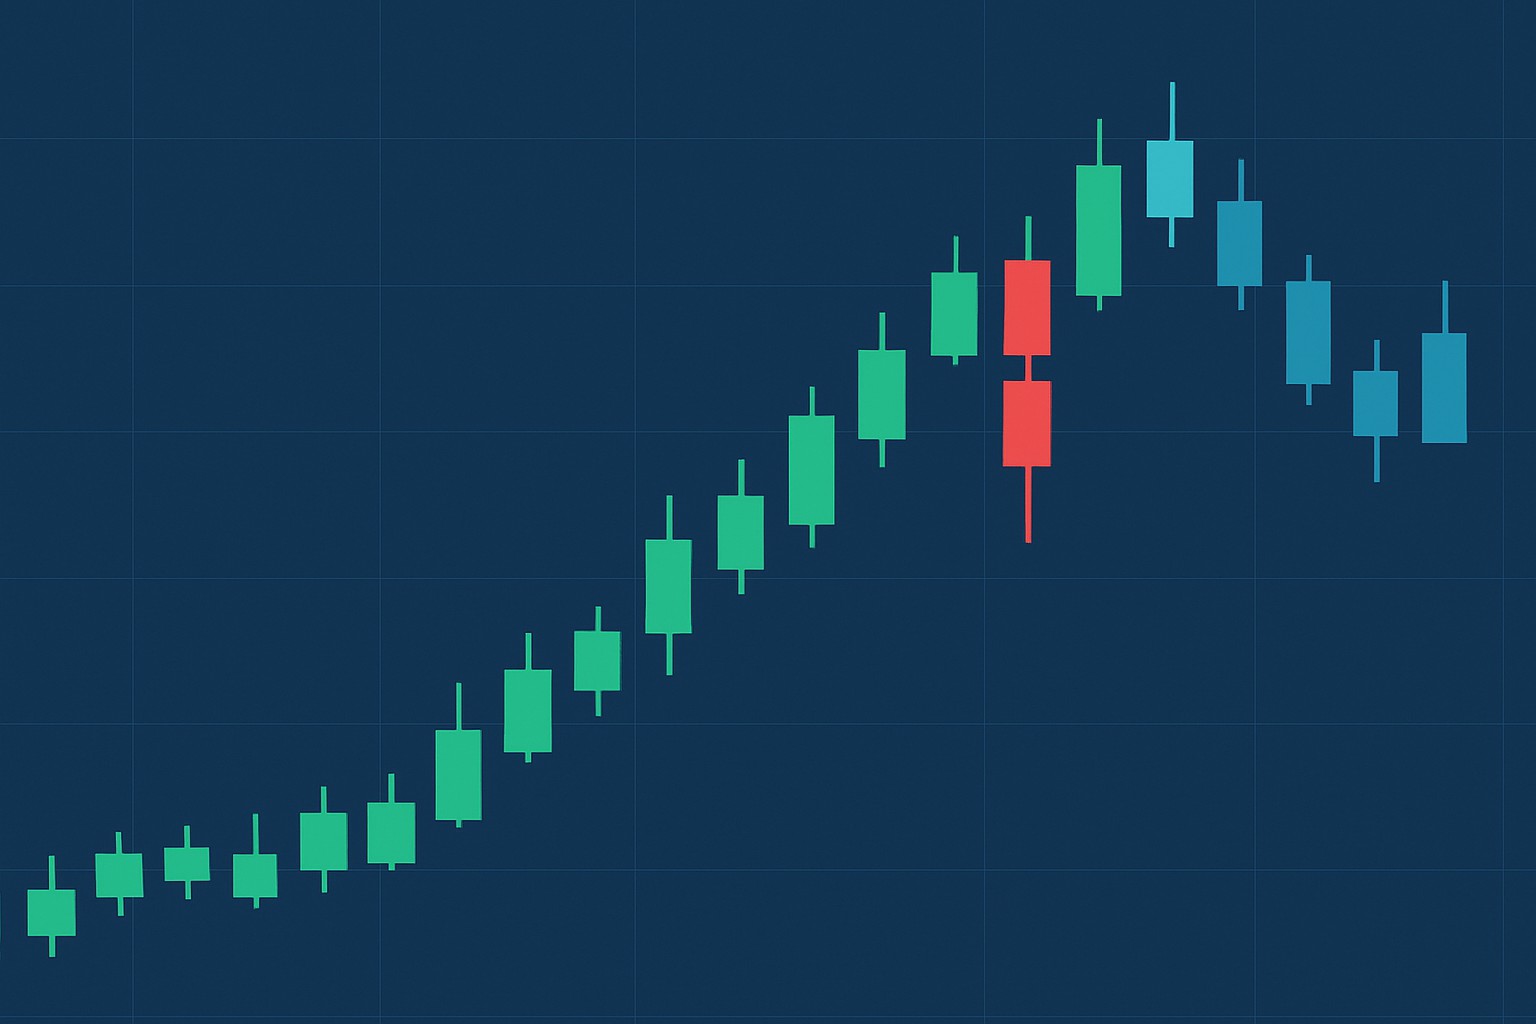
What 3 white soldiers reveal about market direction?
The 3 white soldiers pattern is a powerful bullish signal in technical analysis, revealing sustained buying pressure and potential trend reversal. Learn how this pattern can illuminate market direction for traders.

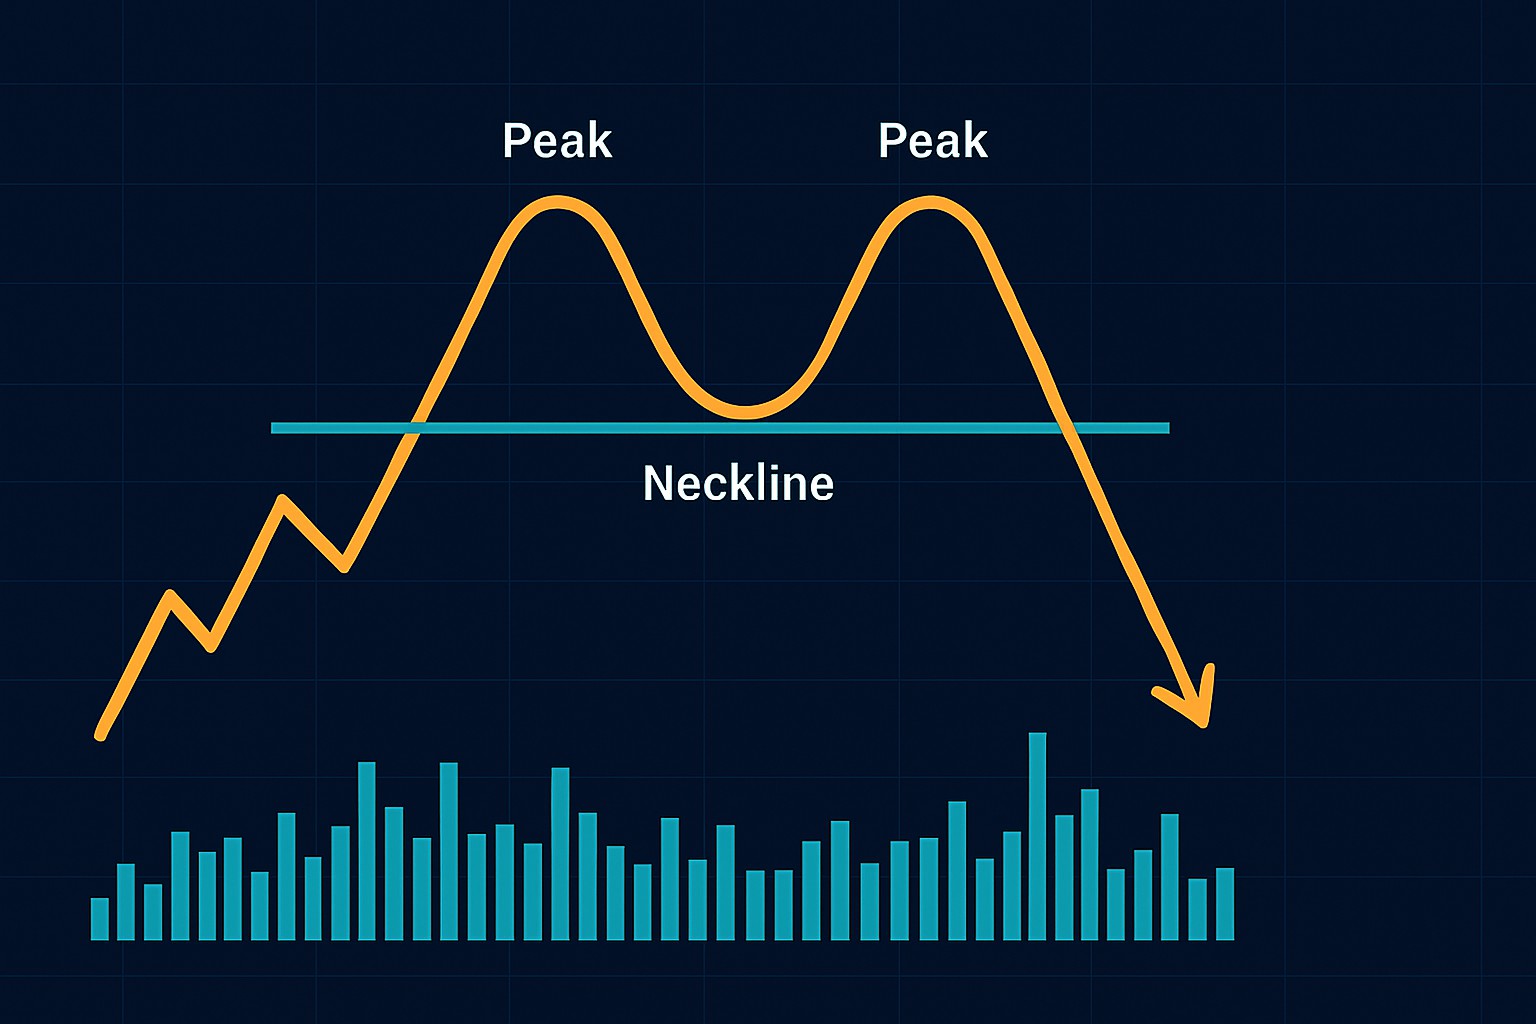
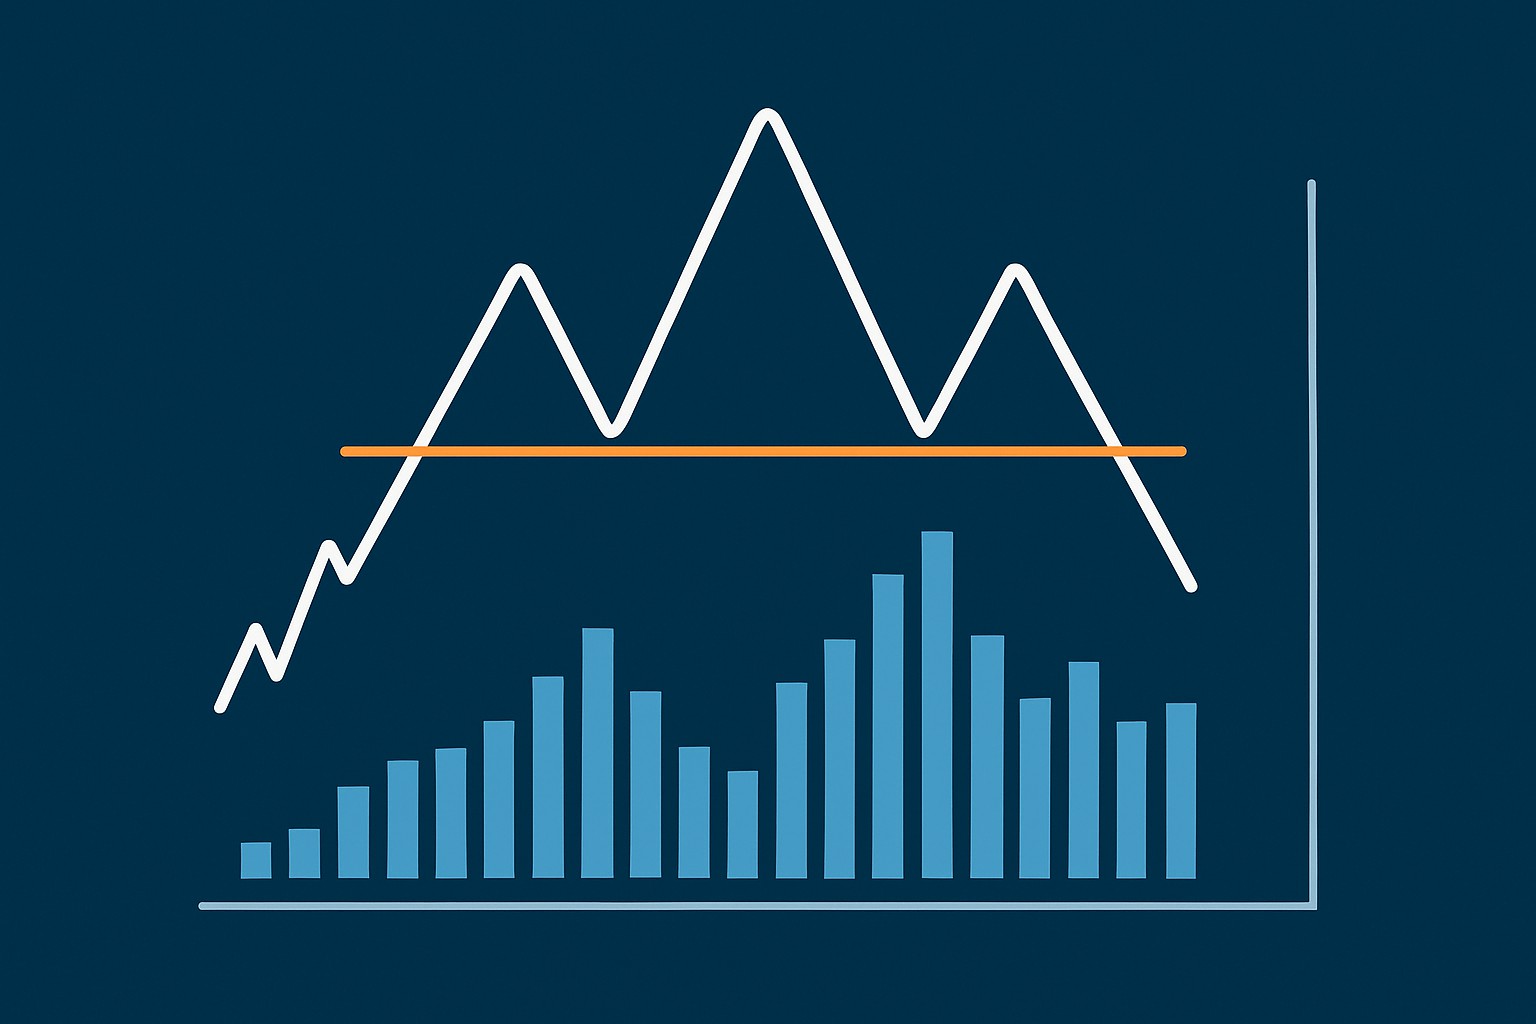
How to Spot a Double Top Chart Pattern
Discover how to reliably spot the double top chart pattern and use it to anticipate price reversals, optimize your trading entries, and manage risks effectively.
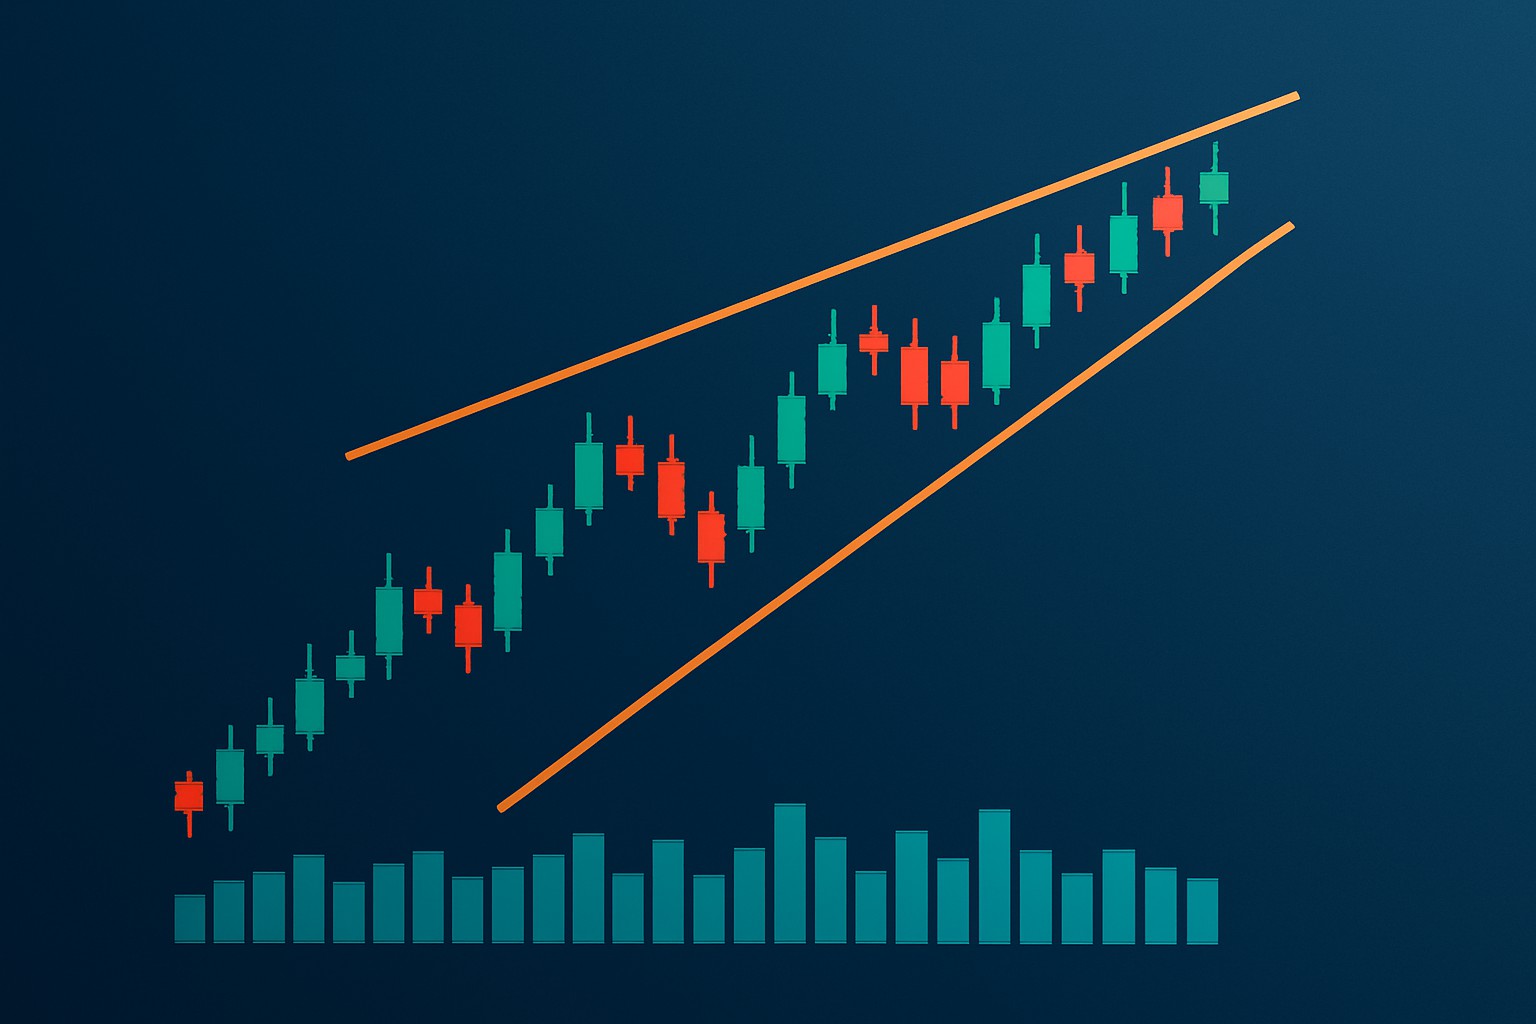
Spot Ascending Wedge Before it Breaks Down
Master the art of spotting ascending wedge patterns before they break down. This guide breaks down step-by-step techniques, indicators, and trade strategies to help you act confidently and protect your portfolio.

How to Read a Hanging Man Candlestick in Your Chart Analysis
Discover the hanging man candlestick pattern, a vital technical analysis tool that signals possible bearish reversals. This guide breaks down its meaning, identification, and practical uses for traders of all levels.

Bearish Pennant Patterns and What They Mean for Traders
Bearish pennant patterns signal brief pauses before downward price trends continue. Discover how to identify, trade, and avoid common pitfalls with this key technical analysis formation.

Spotting the Head and Shoulders Reversal Formation
Discover the head and shoulders pattern, a powerful chart formation that signals market reversals. This guide breaks down the pattern, identification steps, and trading strategies for all experience levels.

How to Spot and Trade the Dragonfly Doji Reversal Signal
Discover the dragonfly doji candlestick pattern, a key reversal signal in trading, and learn practical strategies to spot and trade it effectively.

How to Spot Bearish Engulfing Candles to Time Your Trades
Master spotting bearish engulfing candles to better time your trades and spot potential reversals. This guide breaks down actionable steps for traders at any experience level.
Trading Patterns Cheat Sheet That You Can Keep Handy
Simplify your trading strategy with a comprehensive trading patterns cheat sheet. Learn how to spot key formations and make smarter market moves confidently.
